Immigrants vs Tongan Currently Married
COMPARE
Immigrants
Tongan
Currently Married
Currently Married Comparison
Immigrants
Tongans
45.8%
CURRENTLY MARRIED
11.2/ 100
METRIC RATING
206th/ 347
METRIC RANK
48.3%
CURRENTLY MARRIED
98.2/ 100
METRIC RATING
66th/ 347
METRIC RANK
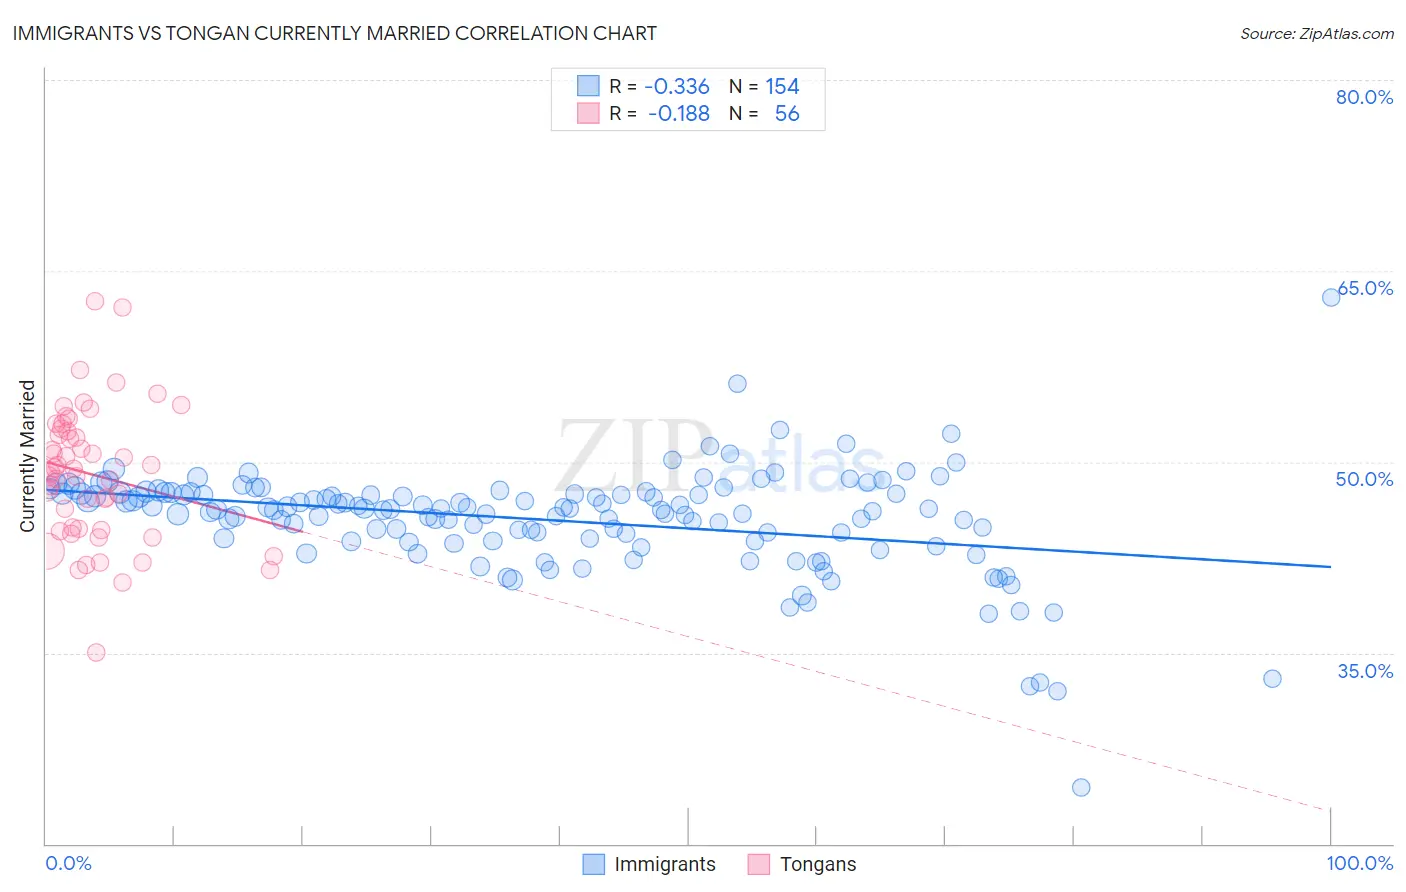
Immigrants vs Tongan Currently Married Correlation Chart
The statistical analysis conducted on geographies consisting of 577,640,121 people shows a mild negative correlation between the proportion of Immigrants and percentage of population currently married in the United States with a correlation coefficient (R) of -0.336 and weighted average of 45.8%. Similarly, the statistical analysis conducted on geographies consisting of 102,907,109 people shows a poor negative correlation between the proportion of Tongans and percentage of population currently married in the United States with a correlation coefficient (R) of -0.188 and weighted average of 48.3%, a difference of 5.7%.
Currently Married Correlation Summary
| Measurement | Immigrants | Tongan |
| Minimum | 24.5% | 35.0% |
| Maximum | 62.9% | 62.6% |
| Range | 38.5% | 27.6% |
| Mean | 45.4% | 49.0% |
| Median | 46.3% | 49.3% |
| Interquartile 25% (IQ1) | 43.8% | 44.7% |
| Interquartile 75% (IQ3) | 47.5% | 52.5% |
| Interquartile Range (IQR) | 3.7% | 7.8% |
| Standard Deviation (Sample) | 4.2% | 5.3% |
| Standard Deviation (Population) | 4.2% | 5.3% |
Similar Demographics by Currently Married
Demographics Similar to Immigrants by Currently Married
In terms of currently married, the demographic groups most similar to Immigrants are South American Indian (45.8%, a difference of 0.020%), Taiwanese (45.8%, a difference of 0.040%), Immigrants from Spain (45.8%, a difference of 0.040%), Immigrants from South America (45.7%, a difference of 0.040%), and Alsatian (45.7%, a difference of 0.050%).
| Demographics | Rating | Rank | Currently Married |
| Immigrants | Costa Rica | 19.6 /100 | #199 | Poor 46.0% |
| Creek | 17.2 /100 | #200 | Poor 46.0% |
| Malaysians | 15.3 /100 | #201 | Poor 45.9% |
| Immigrants | Albania | 14.5 /100 | #202 | Poor 45.9% |
| Taiwanese | 11.7 /100 | #203 | Poor 45.8% |
| Immigrants | Spain | 11.6 /100 | #204 | Poor 45.8% |
| South American Indians | 11.5 /100 | #205 | Poor 45.8% |
| Immigrants | Immigrants | 11.2 /100 | #206 | Poor 45.8% |
| Immigrants | South America | 10.8 /100 | #207 | Poor 45.7% |
| Alsatians | 10.8 /100 | #208 | Poor 45.7% |
| Immigrants | Micronesia | 8.8 /100 | #209 | Tragic 45.6% |
| Uruguayans | 7.9 /100 | #210 | Tragic 45.6% |
| Houma | 7.2 /100 | #211 | Tragic 45.5% |
| Marshallese | 7.2 /100 | #212 | Tragic 45.5% |
| Alaska Natives | 7.0 /100 | #213 | Tragic 45.5% |
Demographics Similar to Tongans by Currently Married
In terms of currently married, the demographic groups most similar to Tongans are Slovak (48.3%, a difference of 0.010%), Immigrants from England (48.3%, a difference of 0.020%), Immigrants from Czechoslovakia (48.4%, a difference of 0.030%), Ukrainian (48.4%, a difference of 0.030%), and Slavic (48.4%, a difference of 0.040%).
| Demographics | Rating | Rank | Currently Married |
| Immigrants | Ireland | 98.5 /100 | #59 | Exceptional 48.4% |
| Immigrants | Romania | 98.5 /100 | #60 | Exceptional 48.4% |
| Romanians | 98.5 /100 | #61 | Exceptional 48.4% |
| Asians | 98.5 /100 | #62 | Exceptional 48.4% |
| Slavs | 98.3 /100 | #63 | Exceptional 48.4% |
| Immigrants | Czechoslovakia | 98.3 /100 | #64 | Exceptional 48.4% |
| Ukrainians | 98.3 /100 | #65 | Exceptional 48.4% |
| Tongans | 98.2 /100 | #66 | Exceptional 48.3% |
| Slovaks | 98.2 /100 | #67 | Exceptional 48.3% |
| Immigrants | England | 98.2 /100 | #68 | Exceptional 48.3% |
| Canadians | 98.1 /100 | #69 | Exceptional 48.3% |
| Immigrants | Asia | 97.9 /100 | #70 | Exceptional 48.3% |
| Macedonians | 97.9 /100 | #71 | Exceptional 48.3% |
| Immigrants | Lebanon | 97.6 /100 | #72 | Exceptional 48.2% |
| Immigrants | Eastern Asia | 97.5 /100 | #73 | Exceptional 48.2% |