Immigrants from Uzbekistan vs Immigrants from Yemen Family Households
COMPARE
Immigrants from Uzbekistan
Immigrants from Yemen
Family Households
Family Households Comparison
Immigrants from Uzbekistan
Immigrants from Yemen
63.4%
FAMILY HOUSEHOLDS
1.5/ 100
METRIC RATING
247th/ 347
METRIC RANK
63.0%
FAMILY HOUSEHOLDS
0.2/ 100
METRIC RATING
279th/ 347
METRIC RANK
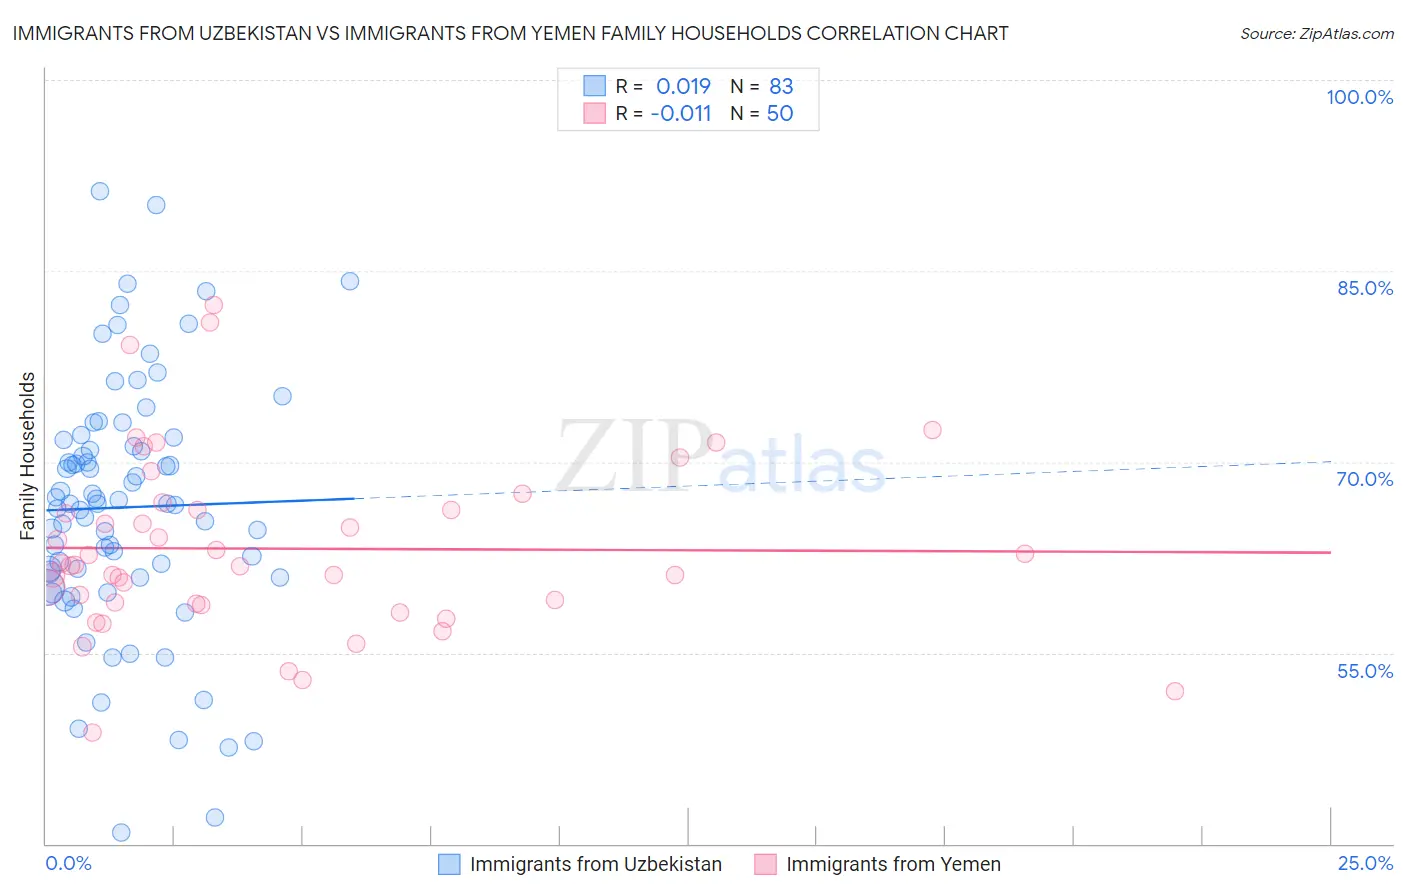
Immigrants from Uzbekistan vs Immigrants from Yemen Family Households Correlation Chart
The statistical analysis conducted on geographies consisting of 118,723,370 people shows no correlation between the proportion of Immigrants from Uzbekistan and percentage of family households in the United States with a correlation coefficient (R) of 0.019 and weighted average of 63.4%. Similarly, the statistical analysis conducted on geographies consisting of 82,431,124 people shows no correlation between the proportion of Immigrants from Yemen and percentage of family households in the United States with a correlation coefficient (R) of -0.011 and weighted average of 63.0%, a difference of 0.69%.
Family Households Correlation Summary
| Measurement | Immigrants from Uzbekistan | Immigrants from Yemen |
| Minimum | 40.8% | 48.7% |
| Maximum | 91.2% | 82.3% |
| Range | 50.4% | 33.6% |
| Mean | 66.4% | 63.2% |
| Median | 66.7% | 61.9% |
| Interquartile 25% (IQ1) | 60.9% | 58.8% |
| Interquartile 75% (IQ3) | 71.7% | 66.2% |
| Interquartile Range (IQR) | 10.8% | 7.4% |
| Standard Deviation (Sample) | 9.9% | 7.0% |
| Standard Deviation (Population) | 9.9% | 6.9% |
Similar Demographics by Family Households
Demographics Similar to Immigrants from Uzbekistan by Family Households
In terms of family households, the demographic groups most similar to Immigrants from Uzbekistan are Immigrants from Ghana (63.4%, a difference of 0.010%), Dominican (63.4%, a difference of 0.010%), Russian (63.4%, a difference of 0.020%), Eastern European (63.4%, a difference of 0.030%), and Immigrants from Dominica (63.4%, a difference of 0.030%).
| Demographics | Rating | Rank | Family Households |
| South Africans | 1.9 /100 | #240 | Tragic 63.4% |
| Immigrants | St. Vincent and the Grenadines | 1.9 /100 | #241 | Tragic 63.4% |
| Immigrants | Israel | 1.8 /100 | #242 | Tragic 63.4% |
| Immigrants | Czechoslovakia | 1.8 /100 | #243 | Tragic 63.4% |
| Eastern Europeans | 1.6 /100 | #244 | Tragic 63.4% |
| Immigrants | Dominica | 1.6 /100 | #245 | Tragic 63.4% |
| Immigrants | Ghana | 1.6 /100 | #246 | Tragic 63.4% |
| Immigrants | Uzbekistan | 1.5 /100 | #247 | Tragic 63.4% |
| Dominicans | 1.5 /100 | #248 | Tragic 63.4% |
| Russians | 1.4 /100 | #249 | Tragic 63.4% |
| Immigrants | Japan | 1.4 /100 | #250 | Tragic 63.4% |
| Taiwanese | 1.2 /100 | #251 | Tragic 63.3% |
| Bahamians | 1.1 /100 | #252 | Tragic 63.3% |
| Immigrants | Dominican Republic | 1.0 /100 | #253 | Tragic 63.3% |
| Slovaks | 1.0 /100 | #254 | Tragic 63.3% |
Demographics Similar to Immigrants from Yemen by Family Households
In terms of family households, the demographic groups most similar to Immigrants from Yemen are Immigrants from Bulgaria (63.0%, a difference of 0.010%), Immigrants from Belgium (63.0%, a difference of 0.040%), Ottawa (63.0%, a difference of 0.080%), Estonian (62.9%, a difference of 0.11%), and Serbian (63.0%, a difference of 0.13%).
| Demographics | Rating | Rank | Family Households |
| Immigrants | Turkey | 0.3 /100 | #272 | Tragic 63.1% |
| Immigrants | Kazakhstan | 0.3 /100 | #273 | Tragic 63.1% |
| Lumbee | 0.3 /100 | #274 | Tragic 63.1% |
| West Indians | 0.3 /100 | #275 | Tragic 63.1% |
| Serbians | 0.3 /100 | #276 | Tragic 63.0% |
| Ottawa | 0.3 /100 | #277 | Tragic 63.0% |
| Immigrants | Belgium | 0.2 /100 | #278 | Tragic 63.0% |
| Immigrants | Yemen | 0.2 /100 | #279 | Tragic 63.0% |
| Immigrants | Bulgaria | 0.2 /100 | #280 | Tragic 63.0% |
| Estonians | 0.2 /100 | #281 | Tragic 62.9% |
| New Zealanders | 0.1 /100 | #282 | Tragic 62.9% |
| Immigrants | Denmark | 0.1 /100 | #283 | Tragic 62.9% |
| Australians | 0.1 /100 | #284 | Tragic 62.8% |
| Mongolians | 0.1 /100 | #285 | Tragic 62.8% |
| British West Indians | 0.1 /100 | #286 | Tragic 62.8% |