Immigrants from Uzbekistan vs Alaska Native Family Households
COMPARE
Immigrants from Uzbekistan
Alaska Native
Family Households
Family Households Comparison
Immigrants from Uzbekistan
Alaska Natives
63.4%
FAMILY HOUSEHOLDS
1.5/ 100
METRIC RATING
247th/ 347
METRIC RANK
65.1%
FAMILY HOUSEHOLDS
97.3/ 100
METRIC RATING
107th/ 347
METRIC RANK
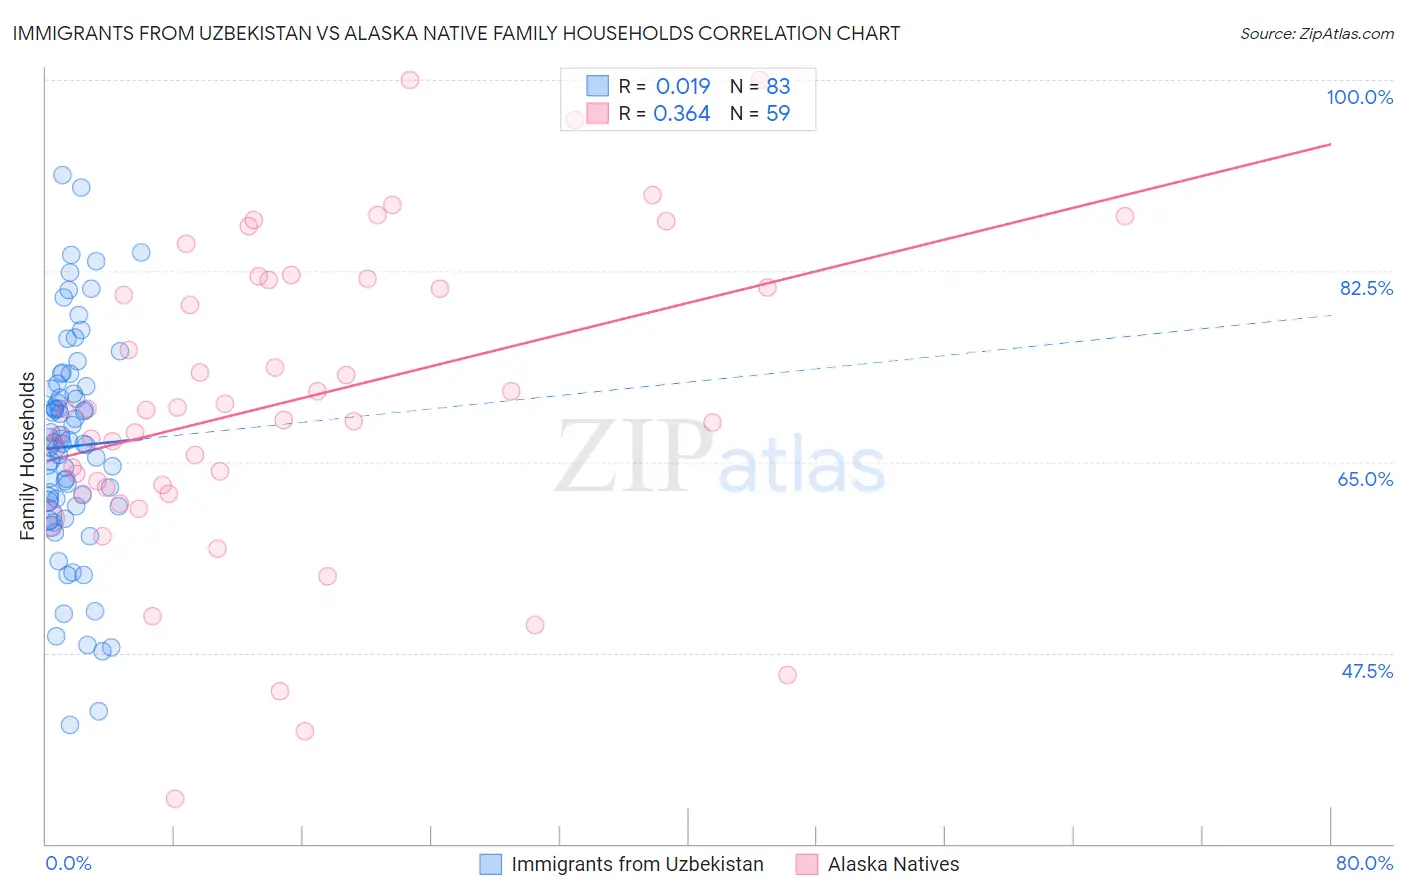
Immigrants from Uzbekistan vs Alaska Native Family Households Correlation Chart
The statistical analysis conducted on geographies consisting of 118,723,370 people shows no correlation between the proportion of Immigrants from Uzbekistan and percentage of family households in the United States with a correlation coefficient (R) of 0.019 and weighted average of 63.4%. Similarly, the statistical analysis conducted on geographies consisting of 76,756,415 people shows a mild positive correlation between the proportion of Alaska Natives and percentage of family households in the United States with a correlation coefficient (R) of 0.364 and weighted average of 65.1%, a difference of 2.6%.
Family Households Correlation Summary
| Measurement | Immigrants from Uzbekistan | Alaska Native |
| Minimum | 40.8% | 34.1% |
| Maximum | 91.2% | 100.0% |
| Range | 50.4% | 65.9% |
| Mean | 66.4% | 70.5% |
| Median | 66.7% | 69.7% |
| Interquartile 25% (IQ1) | 60.9% | 62.6% |
| Interquartile 75% (IQ3) | 71.7% | 81.7% |
| Interquartile Range (IQR) | 10.8% | 19.1% |
| Standard Deviation (Sample) | 9.9% | 14.0% |
| Standard Deviation (Population) | 9.9% | 13.9% |
Similar Demographics by Family Households
Demographics Similar to Immigrants from Uzbekistan by Family Households
In terms of family households, the demographic groups most similar to Immigrants from Uzbekistan are Immigrants from Ghana (63.4%, a difference of 0.010%), Dominican (63.4%, a difference of 0.010%), Russian (63.4%, a difference of 0.020%), Eastern European (63.4%, a difference of 0.030%), and Immigrants from Dominica (63.4%, a difference of 0.030%).
| Demographics | Rating | Rank | Family Households |
| South Africans | 1.9 /100 | #240 | Tragic 63.4% |
| Immigrants | St. Vincent and the Grenadines | 1.9 /100 | #241 | Tragic 63.4% |
| Immigrants | Israel | 1.8 /100 | #242 | Tragic 63.4% |
| Immigrants | Czechoslovakia | 1.8 /100 | #243 | Tragic 63.4% |
| Eastern Europeans | 1.6 /100 | #244 | Tragic 63.4% |
| Immigrants | Dominica | 1.6 /100 | #245 | Tragic 63.4% |
| Immigrants | Ghana | 1.6 /100 | #246 | Tragic 63.4% |
| Immigrants | Uzbekistan | 1.5 /100 | #247 | Tragic 63.4% |
| Dominicans | 1.5 /100 | #248 | Tragic 63.4% |
| Russians | 1.4 /100 | #249 | Tragic 63.4% |
| Immigrants | Japan | 1.4 /100 | #250 | Tragic 63.4% |
| Taiwanese | 1.2 /100 | #251 | Tragic 63.3% |
| Bahamians | 1.1 /100 | #252 | Tragic 63.3% |
| Immigrants | Dominican Republic | 1.0 /100 | #253 | Tragic 63.3% |
| Slovaks | 1.0 /100 | #254 | Tragic 63.3% |
Demographics Similar to Alaska Natives by Family Households
In terms of family households, the demographic groups most similar to Alaska Natives are White/Caucasian (65.1%, a difference of 0.0%), English (65.1%, a difference of 0.010%), Palestinian (65.1%, a difference of 0.010%), Immigrants from Guatemala (65.0%, a difference of 0.050%), and Scandinavian (65.0%, a difference of 0.060%).
| Demographics | Rating | Rank | Family Households |
| Haitians | 98.1 /100 | #100 | Exceptional 65.2% |
| Chileans | 98.1 /100 | #101 | Exceptional 65.2% |
| Immigrants | Sri Lanka | 98.0 /100 | #102 | Exceptional 65.1% |
| Indians (Asian) | 97.9 /100 | #103 | Exceptional 65.1% |
| Spaniards | 97.8 /100 | #104 | Exceptional 65.1% |
| English | 97.4 /100 | #105 | Exceptional 65.1% |
| Whites/Caucasians | 97.3 /100 | #106 | Exceptional 65.1% |
| Alaska Natives | 97.3 /100 | #107 | Exceptional 65.1% |
| Palestinians | 97.2 /100 | #108 | Exceptional 65.1% |
| Immigrants | Guatemala | 96.9 /100 | #109 | Exceptional 65.0% |
| Scandinavians | 96.8 /100 | #110 | Exceptional 65.0% |
| Europeans | 96.8 /100 | #111 | Exceptional 65.0% |
| Immigrants | Jordan | 96.5 /100 | #112 | Exceptional 65.0% |
| Spanish | 96.2 /100 | #113 | Exceptional 65.0% |
| Argentineans | 95.7 /100 | #114 | Exceptional 65.0% |