Immigrants from Sudan vs Irish Married-couple Households
COMPARE
Immigrants from Sudan
Irish
Married-couple Households
Married-couple Households Comparison
Immigrants from Sudan
Irish
41.9%
MARRIED-COUPLE HOUSEHOLDS
0.0/ 100
METRIC RATING
296th/ 347
METRIC RANK
48.6%
MARRIED-COUPLE HOUSEHOLDS
99.3/ 100
METRIC RATING
52nd/ 347
METRIC RANK
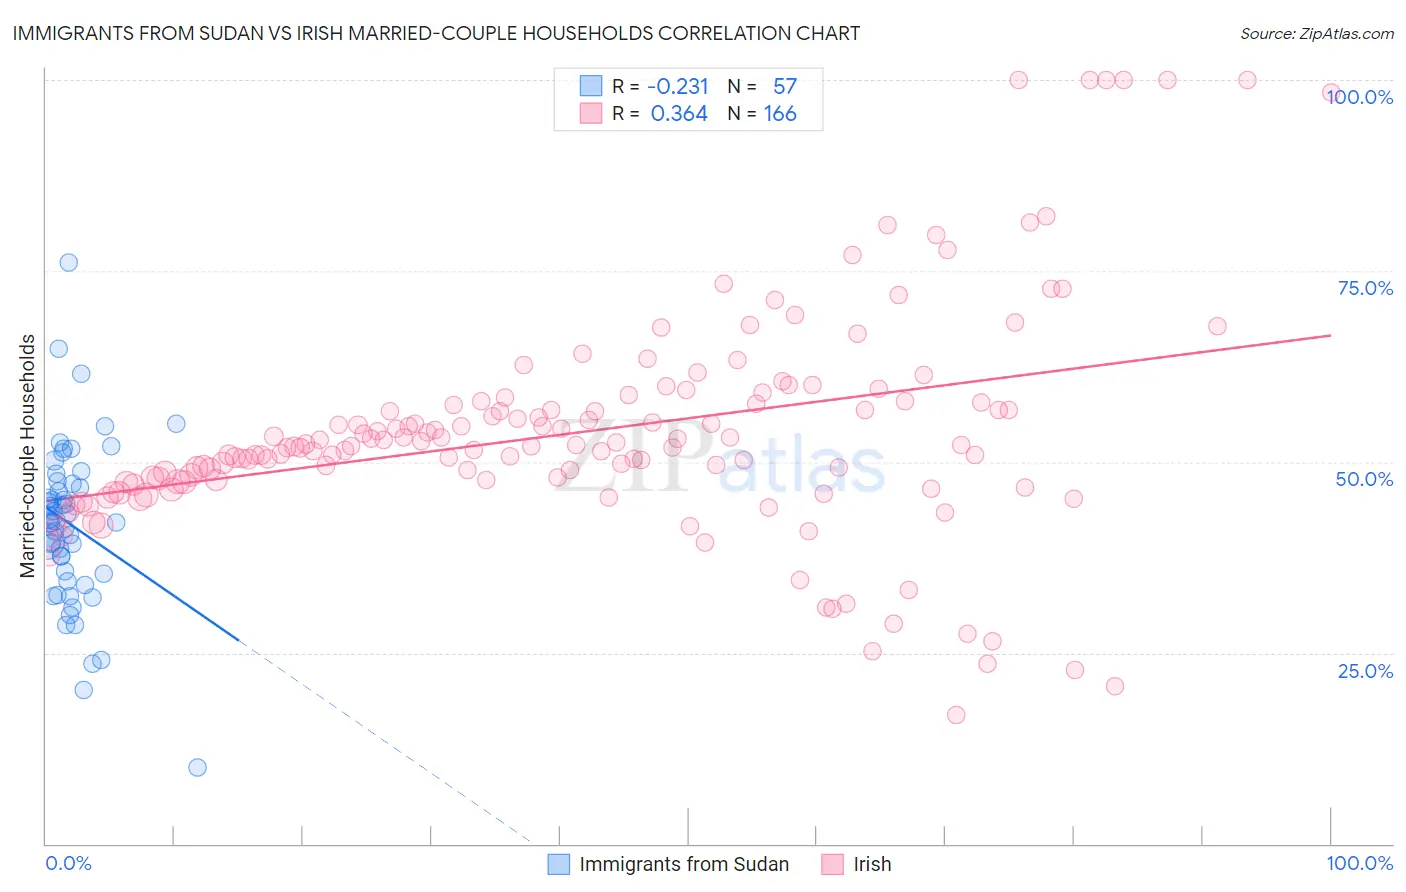
Immigrants from Sudan vs Irish Married-couple Households Correlation Chart
The statistical analysis conducted on geographies consisting of 118,946,439 people shows a weak negative correlation between the proportion of Immigrants from Sudan and percentage of married-couple family households in the United States with a correlation coefficient (R) of -0.231 and weighted average of 41.9%. Similarly, the statistical analysis conducted on geographies consisting of 579,966,528 people shows a mild positive correlation between the proportion of Irish and percentage of married-couple family households in the United States with a correlation coefficient (R) of 0.364 and weighted average of 48.6%, a difference of 15.9%.
Married-couple Households Correlation Summary
| Measurement | Immigrants from Sudan | Irish |
| Minimum | 10.0% | 16.8% |
| Maximum | 76.0% | 100.0% |
| Range | 66.0% | 83.2% |
| Mean | 41.7% | 54.0% |
| Median | 42.1% | 52.1% |
| Interquartile 25% (IQ1) | 34.9% | 47.4% |
| Interquartile 75% (IQ3) | 47.3% | 57.8% |
| Interquartile Range (IQR) | 12.4% | 10.4% |
| Standard Deviation (Sample) | 10.9% | 14.7% |
| Standard Deviation (Population) | 10.8% | 14.7% |
Similar Demographics by Married-couple Households
Demographics Similar to Immigrants from Sudan by Married-couple Households
In terms of married-couple households, the demographic groups most similar to Immigrants from Sudan are Menominee (42.0%, a difference of 0.11%), Immigrants from Yemen (42.0%, a difference of 0.11%), Kiowa (42.0%, a difference of 0.11%), Indonesian (42.0%, a difference of 0.22%), and Paiute (42.1%, a difference of 0.27%).
| Demographics | Rating | Rank | Married-couple Households |
| Sudanese | 0.0 /100 | #289 | Tragic 42.1% |
| Hondurans | 0.0 /100 | #290 | Tragic 42.1% |
| Paiute | 0.0 /100 | #291 | Tragic 42.1% |
| Indonesians | 0.0 /100 | #292 | Tragic 42.0% |
| Menominee | 0.0 /100 | #293 | Tragic 42.0% |
| Immigrants | Yemen | 0.0 /100 | #294 | Tragic 42.0% |
| Kiowa | 0.0 /100 | #295 | Tragic 42.0% |
| Immigrants | Sudan | 0.0 /100 | #296 | Tragic 41.9% |
| Arapaho | 0.0 /100 | #297 | Tragic 41.8% |
| Immigrants | Middle Africa | 0.0 /100 | #298 | Tragic 41.8% |
| Immigrants | Ghana | 0.0 /100 | #299 | Tragic 41.8% |
| Immigrants | Belize | 0.0 /100 | #300 | Tragic 41.8% |
| Immigrants | Bahamas | 0.0 /100 | #301 | Tragic 41.7% |
| Immigrants | Honduras | 0.0 /100 | #302 | Tragic 41.6% |
| Sub-Saharan Africans | 0.0 /100 | #303 | Tragic 41.6% |
Demographics Similar to Irish by Married-couple Households
In terms of married-couple households, the demographic groups most similar to Irish are Eastern European (48.6%, a difference of 0.040%), White/Caucasian (48.6%, a difference of 0.050%), Immigrants from Lithuania (48.6%, a difference of 0.060%), Austrian (48.6%, a difference of 0.060%), and Immigrants from Northern Europe (48.6%, a difference of 0.070%).
| Demographics | Rating | Rank | Married-couple Households |
| Immigrants | Eastern Asia | 99.5 /100 | #45 | Exceptional 48.8% |
| Tsimshian | 99.5 /100 | #46 | Exceptional 48.7% |
| British | 99.5 /100 | #47 | Exceptional 48.7% |
| Indians (Asian) | 99.4 /100 | #48 | Exceptional 48.7% |
| Immigrants | Sri Lanka | 99.4 /100 | #49 | Exceptional 48.7% |
| Samoans | 99.4 /100 | #50 | Exceptional 48.7% |
| Eastern Europeans | 99.3 /100 | #51 | Exceptional 48.6% |
| Irish | 99.3 /100 | #52 | Exceptional 48.6% |
| Whites/Caucasians | 99.3 /100 | #53 | Exceptional 48.6% |
| Immigrants | Lithuania | 99.3 /100 | #54 | Exceptional 48.6% |
| Austrians | 99.3 /100 | #55 | Exceptional 48.6% |
| Immigrants | Northern Europe | 99.3 /100 | #56 | Exceptional 48.6% |
| Poles | 99.2 /100 | #57 | Exceptional 48.5% |
| Immigrants | Indonesia | 99.2 /100 | #58 | Exceptional 48.5% |
| Czechoslovakians | 99.2 /100 | #59 | Exceptional 48.5% |