Immigrants from Sudan vs Immigrants from Kuwait Married-couple Households
COMPARE
Immigrants from Sudan
Immigrants from Kuwait
Married-couple Households
Married-couple Households Comparison
Immigrants from Sudan
Immigrants from Kuwait
41.9%
MARRIED-COUPLE HOUSEHOLDS
0.0/ 100
METRIC RATING
296th/ 347
METRIC RANK
46.0%
MARRIED-COUPLE HOUSEHOLDS
25.6/ 100
METRIC RATING
190th/ 347
METRIC RANK
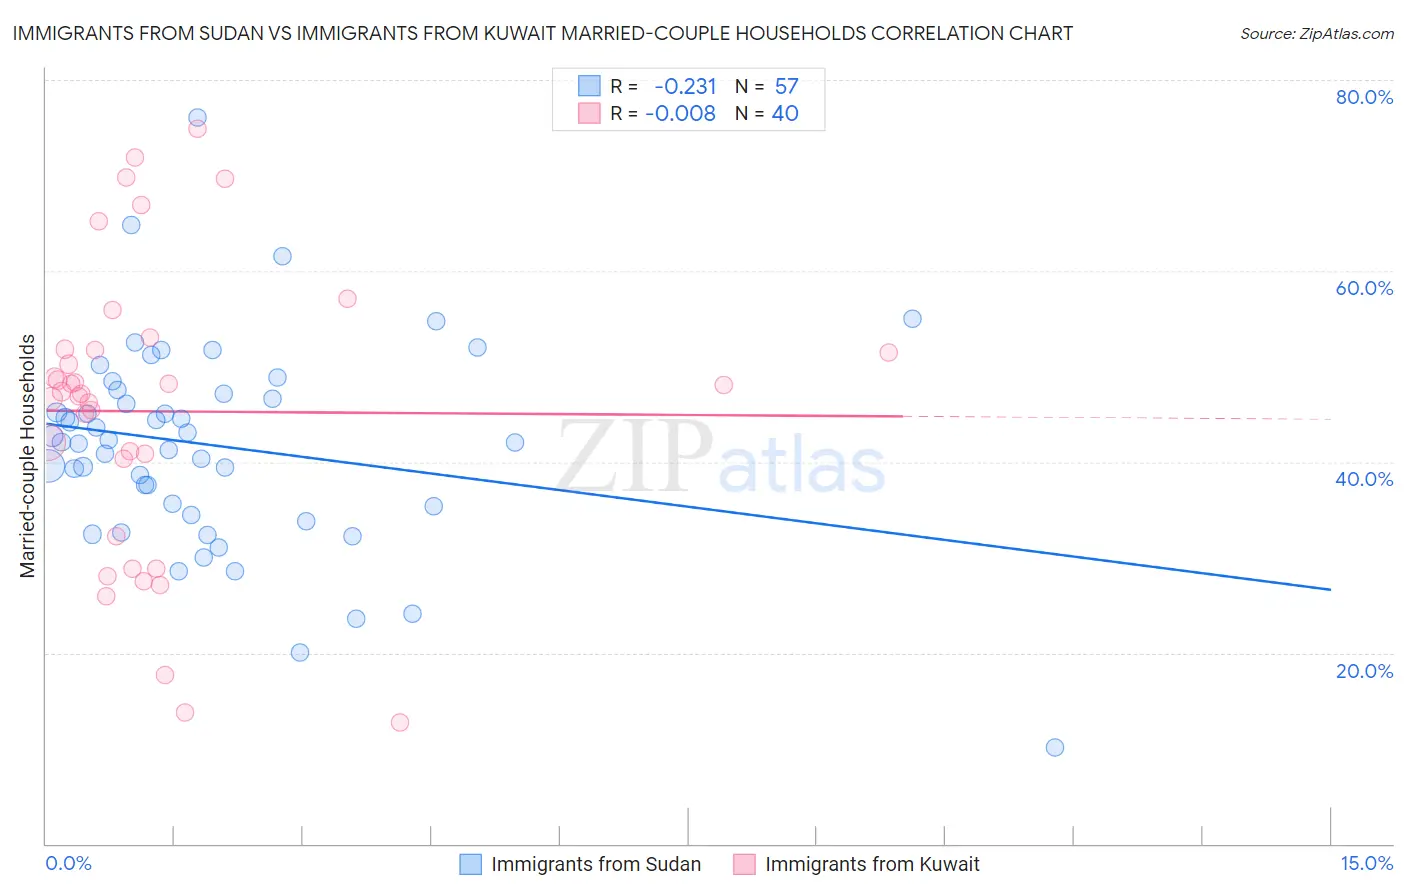
Immigrants from Sudan vs Immigrants from Kuwait Married-couple Households Correlation Chart
The statistical analysis conducted on geographies consisting of 118,946,439 people shows a weak negative correlation between the proportion of Immigrants from Sudan and percentage of married-couple family households in the United States with a correlation coefficient (R) of -0.231 and weighted average of 41.9%. Similarly, the statistical analysis conducted on geographies consisting of 136,888,250 people shows no correlation between the proportion of Immigrants from Kuwait and percentage of married-couple family households in the United States with a correlation coefficient (R) of -0.008 and weighted average of 46.0%, a difference of 9.6%.
Married-couple Households Correlation Summary
| Measurement | Immigrants from Sudan | Immigrants from Kuwait |
| Minimum | 10.0% | 12.7% |
| Maximum | 76.0% | 74.9% |
| Range | 66.0% | 62.1% |
| Mean | 41.7% | 45.3% |
| Median | 42.1% | 47.2% |
| Interquartile 25% (IQ1) | 34.9% | 36.3% |
| Interquartile 75% (IQ3) | 47.3% | 51.7% |
| Interquartile Range (IQR) | 12.4% | 15.5% |
| Standard Deviation (Sample) | 10.9% | 15.3% |
| Standard Deviation (Population) | 10.8% | 15.1% |
Similar Demographics by Married-couple Households
Demographics Similar to Immigrants from Sudan by Married-couple Households
In terms of married-couple households, the demographic groups most similar to Immigrants from Sudan are Menominee (42.0%, a difference of 0.11%), Immigrants from Yemen (42.0%, a difference of 0.11%), Kiowa (42.0%, a difference of 0.11%), Indonesian (42.0%, a difference of 0.22%), and Paiute (42.1%, a difference of 0.27%).
| Demographics | Rating | Rank | Married-couple Households |
| Sudanese | 0.0 /100 | #289 | Tragic 42.1% |
| Hondurans | 0.0 /100 | #290 | Tragic 42.1% |
| Paiute | 0.0 /100 | #291 | Tragic 42.1% |
| Indonesians | 0.0 /100 | #292 | Tragic 42.0% |
| Menominee | 0.0 /100 | #293 | Tragic 42.0% |
| Immigrants | Yemen | 0.0 /100 | #294 | Tragic 42.0% |
| Kiowa | 0.0 /100 | #295 | Tragic 42.0% |
| Immigrants | Sudan | 0.0 /100 | #296 | Tragic 41.9% |
| Arapaho | 0.0 /100 | #297 | Tragic 41.8% |
| Immigrants | Middle Africa | 0.0 /100 | #298 | Tragic 41.8% |
| Immigrants | Ghana | 0.0 /100 | #299 | Tragic 41.8% |
| Immigrants | Belize | 0.0 /100 | #300 | Tragic 41.8% |
| Immigrants | Bahamas | 0.0 /100 | #301 | Tragic 41.7% |
| Immigrants | Honduras | 0.0 /100 | #302 | Tragic 41.6% |
| Sub-Saharan Africans | 0.0 /100 | #303 | Tragic 41.6% |
Demographics Similar to Immigrants from Kuwait by Married-couple Households
In terms of married-couple households, the demographic groups most similar to Immigrants from Kuwait are Choctaw (46.0%, a difference of 0.030%), Immigrants from Northern Africa (46.0%, a difference of 0.050%), Immigrants from Latvia (46.0%, a difference of 0.060%), Taiwanese (45.9%, a difference of 0.11%), and Mexican American Indian (45.9%, a difference of 0.12%).
| Demographics | Rating | Rank | Married-couple Households |
| Immigrants | Brazil | 38.3 /100 | #183 | Fair 46.2% |
| Immigrants | Switzerland | 36.9 /100 | #184 | Fair 46.2% |
| Brazilians | 35.9 /100 | #185 | Fair 46.2% |
| Albanians | 31.1 /100 | #186 | Fair 46.1% |
| Fijians | 29.2 /100 | #187 | Fair 46.1% |
| South American Indians | 28.4 /100 | #188 | Fair 46.0% |
| Immigrants | Latvia | 26.9 /100 | #189 | Fair 46.0% |
| Immigrants | Kuwait | 25.6 /100 | #190 | Fair 46.0% |
| Choctaw | 24.9 /100 | #191 | Fair 46.0% |
| Immigrants | Northern Africa | 24.6 /100 | #192 | Fair 46.0% |
| Taiwanese | 23.4 /100 | #193 | Fair 45.9% |
| Mexican American Indians | 23.3 /100 | #194 | Fair 45.9% |
| Chickasaw | 22.7 /100 | #195 | Fair 45.9% |
| Immigrants | South America | 22.2 /100 | #196 | Fair 45.9% |
| Cambodians | 21.3 /100 | #197 | Fair 45.9% |