Immigrants from Sudan vs Jamaican Married-couple Households
COMPARE
Immigrants from Sudan
Jamaican
Married-couple Households
Married-couple Households Comparison
Immigrants from Sudan
Jamaicans
41.9%
MARRIED-COUPLE HOUSEHOLDS
0.0/ 100
METRIC RATING
296th/ 347
METRIC RANK
40.9%
MARRIED-COUPLE HOUSEHOLDS
0.0/ 100
METRIC RATING
314th/ 347
METRIC RANK
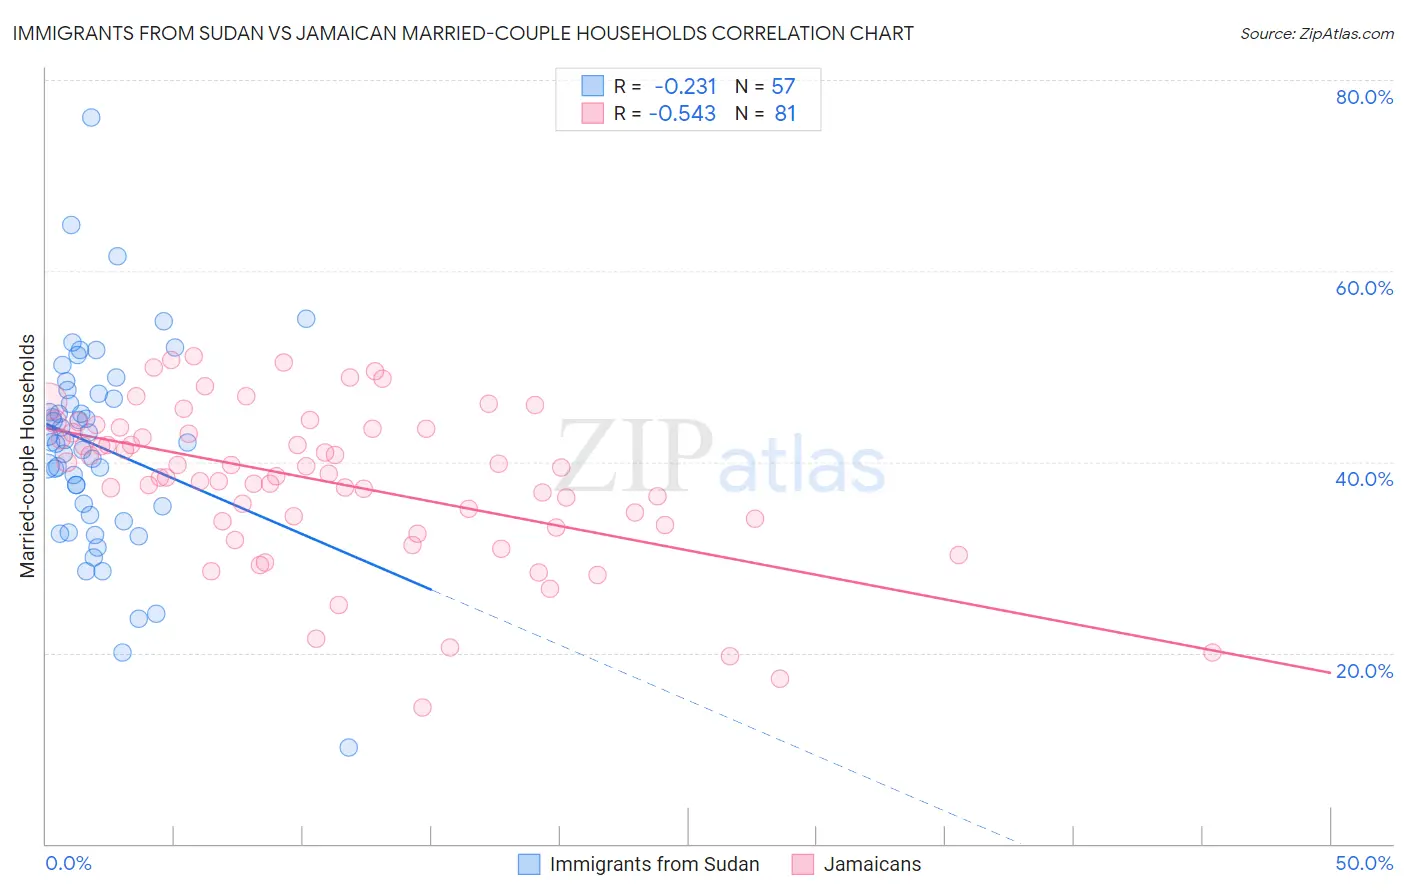
Immigrants from Sudan vs Jamaican Married-couple Households Correlation Chart
The statistical analysis conducted on geographies consisting of 118,946,439 people shows a weak negative correlation between the proportion of Immigrants from Sudan and percentage of married-couple family households in the United States with a correlation coefficient (R) of -0.231 and weighted average of 41.9%. Similarly, the statistical analysis conducted on geographies consisting of 367,621,560 people shows a substantial negative correlation between the proportion of Jamaicans and percentage of married-couple family households in the United States with a correlation coefficient (R) of -0.543 and weighted average of 40.9%, a difference of 2.6%.
Married-couple Households Correlation Summary
| Measurement | Immigrants from Sudan | Jamaican |
| Minimum | 10.0% | 14.3% |
| Maximum | 76.0% | 51.0% |
| Range | 66.0% | 36.7% |
| Mean | 41.7% | 37.9% |
| Median | 42.1% | 38.7% |
| Interquartile 25% (IQ1) | 34.9% | 33.6% |
| Interquartile 75% (IQ3) | 47.3% | 43.5% |
| Interquartile Range (IQR) | 12.4% | 9.9% |
| Standard Deviation (Sample) | 10.9% | 8.1% |
| Standard Deviation (Population) | 10.8% | 8.1% |
Demographics Similar to Immigrants from Sudan and Jamaicans by Married-couple Households
In terms of married-couple households, the demographic groups most similar to Immigrants from Sudan are Kiowa (42.0%, a difference of 0.11%), Arapaho (41.8%, a difference of 0.30%), Immigrants from Middle Africa (41.8%, a difference of 0.33%), Immigrants from Ghana (41.8%, a difference of 0.41%), and Immigrants from Belize (41.8%, a difference of 0.42%). Similarly, the demographic groups most similar to Jamaicans are Immigrants from Haiti (40.9%, a difference of 0.080%), Trinidadian and Tobagonian (40.9%, a difference of 0.080%), African (40.9%, a difference of 0.14%), Colville (41.0%, a difference of 0.22%), and Haitian (41.2%, a difference of 0.72%).
| Demographics | Rating | Rank | Married-couple Households |
| Kiowa | 0.0 /100 | #295 | Tragic 42.0% |
| Immigrants | Sudan | 0.0 /100 | #296 | Tragic 41.9% |
| Arapaho | 0.0 /100 | #297 | Tragic 41.8% |
| Immigrants | Middle Africa | 0.0 /100 | #298 | Tragic 41.8% |
| Immigrants | Ghana | 0.0 /100 | #299 | Tragic 41.8% |
| Immigrants | Belize | 0.0 /100 | #300 | Tragic 41.8% |
| Immigrants | Bahamas | 0.0 /100 | #301 | Tragic 41.7% |
| Immigrants | Honduras | 0.0 /100 | #302 | Tragic 41.6% |
| Sub-Saharan Africans | 0.0 /100 | #303 | Tragic 41.6% |
| Immigrants | Guyana | 0.0 /100 | #304 | Tragic 41.6% |
| Sioux | 0.0 /100 | #305 | Tragic 41.5% |
| Guyanese | 0.0 /100 | #306 | Tragic 41.4% |
| Immigrants | Western Africa | 0.0 /100 | #307 | Tragic 41.4% |
| Crow | 0.0 /100 | #308 | Tragic 41.4% |
| Immigrants | Trinidad and Tobago | 0.0 /100 | #309 | Tragic 41.2% |
| Haitians | 0.0 /100 | #310 | Tragic 41.2% |
| Colville | 0.0 /100 | #311 | Tragic 41.0% |
| Africans | 0.0 /100 | #312 | Tragic 40.9% |
| Immigrants | Haiti | 0.0 /100 | #313 | Tragic 40.9% |
| Jamaicans | 0.0 /100 | #314 | Tragic 40.9% |
| Trinidadians and Tobagonians | 0.0 /100 | #315 | Tragic 40.9% |