Immigrants from St. Vincent and the Grenadines vs Asian Married-couple Households
COMPARE
Immigrants from St. Vincent and the Grenadines
Asian
Married-couple Households
Married-couple Households Comparison
Immigrants from St. Vincent and the Grenadines
Asians
38.7%
MARRIED-COUPLE HOUSEHOLDS
0.0/ 100
METRIC RATING
334th/ 347
METRIC RANK
49.5%
MARRIED-COUPLE HOUSEHOLDS
99.9/ 100
METRIC RATING
22nd/ 347
METRIC RANK
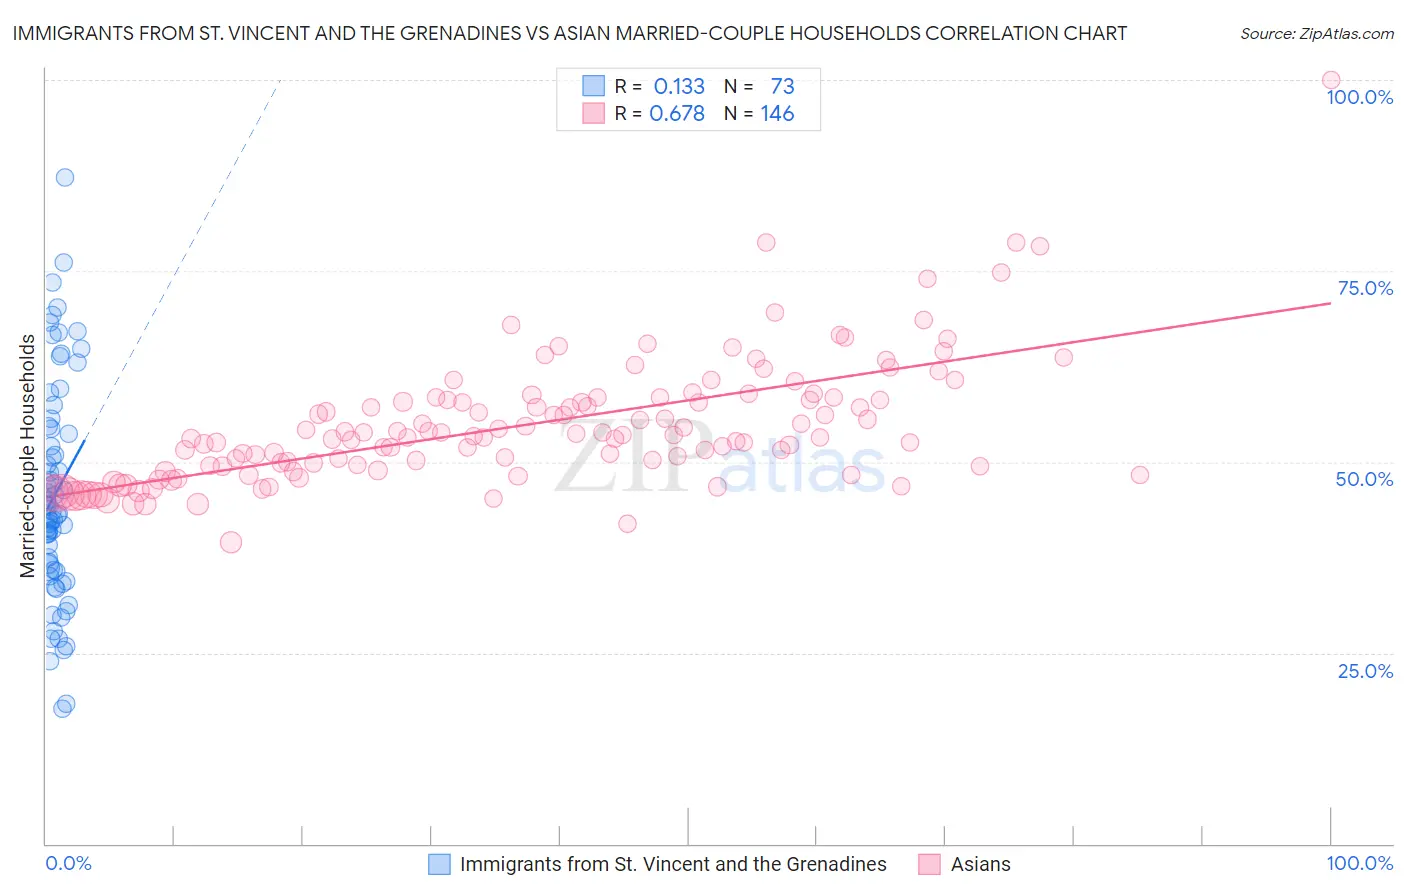
Immigrants from St. Vincent and the Grenadines vs Asian Married-couple Households Correlation Chart
The statistical analysis conducted on geographies consisting of 56,188,620 people shows a poor positive correlation between the proportion of Immigrants from St. Vincent and the Grenadines and percentage of married-couple family households in the United States with a correlation coefficient (R) of 0.133 and weighted average of 38.7%. Similarly, the statistical analysis conducted on geographies consisting of 550,235,479 people shows a significant positive correlation between the proportion of Asians and percentage of married-couple family households in the United States with a correlation coefficient (R) of 0.678 and weighted average of 49.5%, a difference of 27.9%.
Married-couple Households Correlation Summary
| Measurement | Immigrants from St. Vincent and the Grenadines | Asian |
| Minimum | 17.7% | 39.5% |
| Maximum | 87.2% | 100.0% |
| Range | 69.5% | 60.5% |
| Mean | 45.8% | 54.8% |
| Median | 43.5% | 53.3% |
| Interquartile 25% (IQ1) | 35.8% | 49.4% |
| Interquartile 75% (IQ3) | 54.5% | 58.2% |
| Interquartile Range (IQR) | 18.8% | 8.8% |
| Standard Deviation (Sample) | 14.4% | 8.3% |
| Standard Deviation (Population) | 14.3% | 8.3% |
Similar Demographics by Married-couple Households
Demographics Similar to Immigrants from St. Vincent and the Grenadines by Married-couple Households
In terms of married-couple households, the demographic groups most similar to Immigrants from St. Vincent and the Grenadines are Senegalese (38.6%, a difference of 0.33%), Black/African American (38.5%, a difference of 0.51%), Immigrants from Somalia (38.4%, a difference of 0.66%), Immigrants from West Indies (39.0%, a difference of 0.78%), and Somali (39.0%, a difference of 0.81%).
| Demographics | Rating | Rank | Married-couple Households |
| Lumbee | 0.0 /100 | #327 | Tragic 39.6% |
| Barbadians | 0.0 /100 | #328 | Tragic 39.4% |
| Immigrants | Dominica | 0.0 /100 | #329 | Tragic 39.4% |
| Immigrants | Barbados | 0.0 /100 | #330 | Tragic 39.2% |
| Immigrants | Congo | 0.0 /100 | #331 | Tragic 39.0% |
| Somalis | 0.0 /100 | #332 | Tragic 39.0% |
| Immigrants | West Indies | 0.0 /100 | #333 | Tragic 39.0% |
| Immigrants | St. Vincent and the Grenadines | 0.0 /100 | #334 | Tragic 38.7% |
| Senegalese | 0.0 /100 | #335 | Tragic 38.6% |
| Blacks/African Americans | 0.0 /100 | #336 | Tragic 38.5% |
| Immigrants | Somalia | 0.0 /100 | #337 | Tragic 38.4% |
| Immigrants | Senegal | 0.0 /100 | #338 | Tragic 38.4% |
| British West Indians | 0.0 /100 | #339 | Tragic 38.3% |
| Dominicans | 0.0 /100 | #340 | Tragic 38.2% |
| Cape Verdeans | 0.0 /100 | #341 | Tragic 38.1% |
Demographics Similar to Asians by Married-couple Households
In terms of married-couple households, the demographic groups most similar to Asians are Dutch (49.5%, a difference of 0.010%), Czech (49.4%, a difference of 0.090%), Norwegian (49.5%, a difference of 0.11%), European (49.6%, a difference of 0.17%), and Scandinavian (49.6%, a difference of 0.17%).
| Demographics | Rating | Rank | Married-couple Households |
| Koreans | 99.9 /100 | #15 | Exceptional 49.7% |
| Swedes | 99.9 /100 | #16 | Exceptional 49.7% |
| Immigrants | Hong Kong | 99.9 /100 | #17 | Exceptional 49.6% |
| English | 99.9 /100 | #18 | Exceptional 49.6% |
| Europeans | 99.9 /100 | #19 | Exceptional 49.6% |
| Scandinavians | 99.9 /100 | #20 | Exceptional 49.6% |
| Norwegians | 99.9 /100 | #21 | Exceptional 49.5% |
| Asians | 99.9 /100 | #22 | Exceptional 49.5% |
| Dutch | 99.9 /100 | #23 | Exceptional 49.5% |
| Czechs | 99.9 /100 | #24 | Exceptional 49.4% |
| Immigrants | Philippines | 99.9 /100 | #25 | Exceptional 49.3% |
| Immigrants | Scotland | 99.8 /100 | #26 | Exceptional 49.3% |
| Bhutanese | 99.8 /100 | #27 | Exceptional 49.3% |
| Germans | 99.8 /100 | #28 | Exceptional 49.2% |
| Maltese | 99.8 /100 | #29 | Exceptional 49.2% |