Immigrants from Poland vs Immigrants from Norway Family Poverty
COMPARE
Immigrants from Poland
Immigrants from Norway
Family Poverty
Family Poverty Comparison
Immigrants from Poland
Immigrants from Norway
7.9%
FAMILY POVERTY
97.8/ 100
METRIC RATING
82nd/ 347
METRIC RANK
8.1%
FAMILY POVERTY
95.7/ 100
METRIC RATING
101st/ 347
METRIC RANK
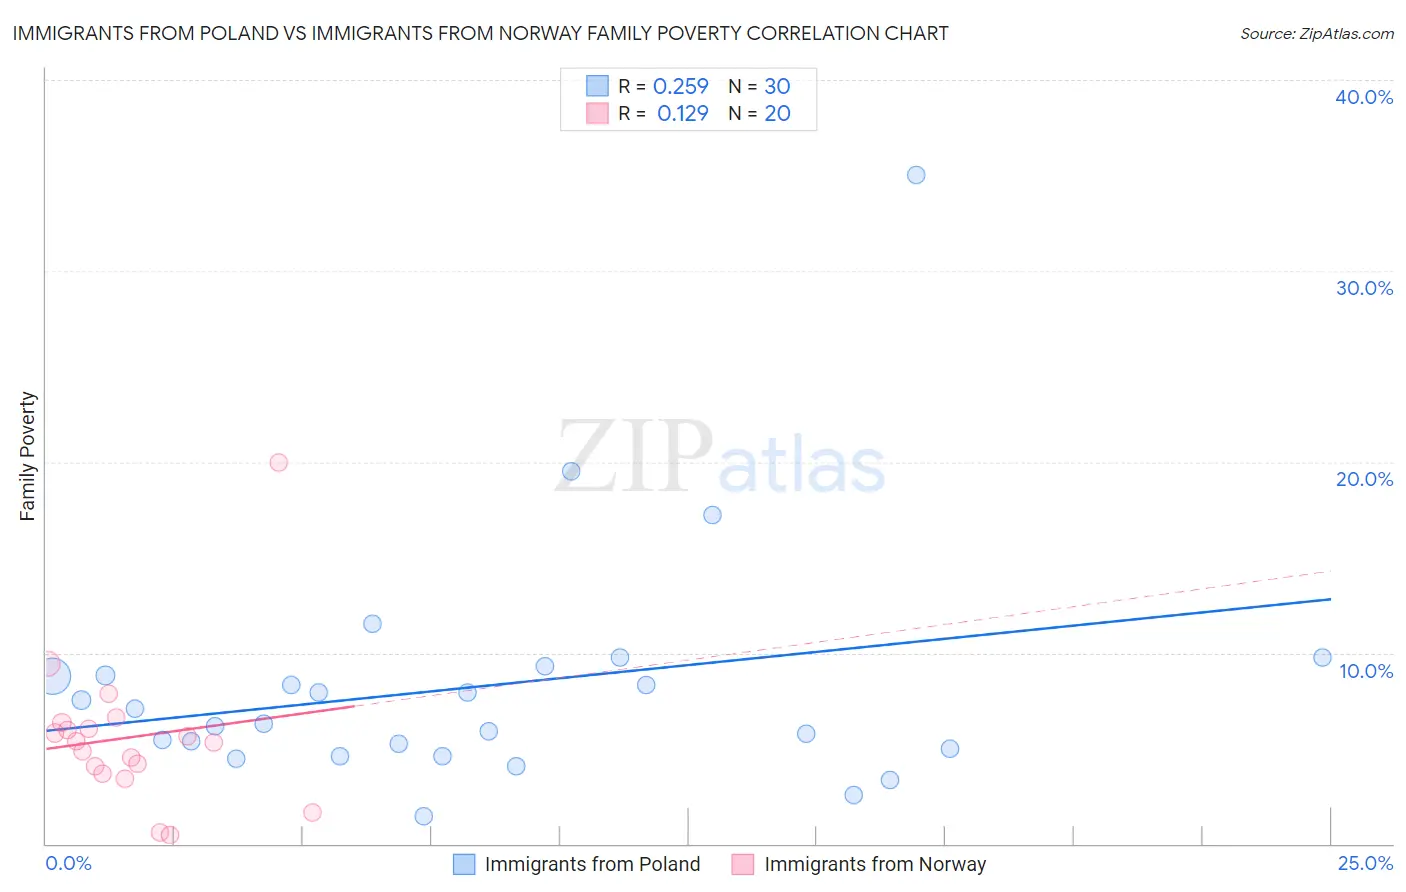
Immigrants from Poland vs Immigrants from Norway Family Poverty Correlation Chart
The statistical analysis conducted on geographies consisting of 304,048,718 people shows a weak positive correlation between the proportion of Immigrants from Poland and poverty level among families in the United States with a correlation coefficient (R) of 0.259 and weighted average of 7.9%. Similarly, the statistical analysis conducted on geographies consisting of 116,627,868 people shows a poor positive correlation between the proportion of Immigrants from Norway and poverty level among families in the United States with a correlation coefficient (R) of 0.129 and weighted average of 8.1%, a difference of 2.5%.
Family Poverty Correlation Summary
| Measurement | Immigrants from Poland | Immigrants from Norway |
| Minimum | 1.5% | 0.43% |
| Maximum | 35.0% | 20.0% |
| Range | 33.5% | 19.6% |
| Mean | 8.2% | 5.6% |
| Median | 6.7% | 5.3% |
| Interquartile 25% (IQ1) | 5.0% | 3.9% |
| Interquartile 75% (IQ3) | 8.8% | 6.2% |
| Interquartile Range (IQR) | 3.8% | 2.3% |
| Standard Deviation (Sample) | 6.3% | 4.0% |
| Standard Deviation (Population) | 6.2% | 3.9% |
Demographics Similar to Immigrants from Poland and Immigrants from Norway by Family Poverty
In terms of family poverty, the demographic groups most similar to Immigrants from Poland are Irish (7.9%, a difference of 0.030%), Slovak (7.9%, a difference of 0.18%), British (7.9%, a difference of 0.42%), Immigrants from Asia (7.9%, a difference of 0.67%), and Scottish (7.9%, a difference of 0.71%). Similarly, the demographic groups most similar to Immigrants from Norway are New Zealander (8.1%, a difference of 0.030%), Welsh (8.1%, a difference of 0.10%), Immigrants from South Africa (8.1%, a difference of 0.17%), Immigrants from Switzerland (8.1%, a difference of 0.38%), and Immigrants from Turkey (8.0%, a difference of 0.79%).
| Demographics | Rating | Rank | Family Poverty |
| Irish | 97.8 /100 | #81 | Exceptional 7.9% |
| Immigrants | Poland | 97.8 /100 | #82 | Exceptional 7.9% |
| Slovaks | 97.7 /100 | #83 | Exceptional 7.9% |
| British | 97.5 /100 | #84 | Exceptional 7.9% |
| Immigrants | Asia | 97.4 /100 | #85 | Exceptional 7.9% |
| Scottish | 97.3 /100 | #86 | Exceptional 7.9% |
| Belgians | 97.3 /100 | #87 | Exceptional 8.0% |
| Serbians | 97.2 /100 | #88 | Exceptional 8.0% |
| Immigrants | Denmark | 97.1 /100 | #89 | Exceptional 8.0% |
| Immigrants | England | 97.1 /100 | #90 | Exceptional 8.0% |
| Immigrants | Italy | 97.0 /100 | #91 | Exceptional 8.0% |
| Czechoslovakians | 96.8 /100 | #92 | Exceptional 8.0% |
| Tlingit-Haida | 96.7 /100 | #93 | Exceptional 8.0% |
| Immigrants | Pakistan | 96.6 /100 | #94 | Exceptional 8.0% |
| Immigrants | Philippines | 96.5 /100 | #95 | Exceptional 8.0% |
| Immigrants | Turkey | 96.5 /100 | #96 | Exceptional 8.0% |
| Immigrants | Switzerland | 96.1 /100 | #97 | Exceptional 8.1% |
| Immigrants | South Africa | 95.9 /100 | #98 | Exceptional 8.1% |
| Welsh | 95.8 /100 | #99 | Exceptional 8.1% |
| New Zealanders | 95.8 /100 | #100 | Exceptional 8.1% |
| Immigrants | Norway | 95.7 /100 | #101 | Exceptional 8.1% |