Immigrants from Panama vs Alaskan Athabascan Family Households
COMPARE
Immigrants from Panama
Alaskan Athabascan
Family Households
Family Households Comparison
Immigrants from Panama
Alaskan Athabascans
64.8%
FAMILY HOUSEHOLDS
92.0/ 100
METRIC RATING
127th/ 347
METRIC RANK
61.8%
FAMILY HOUSEHOLDS
0.0/ 100
METRIC RATING
318th/ 347
METRIC RANK
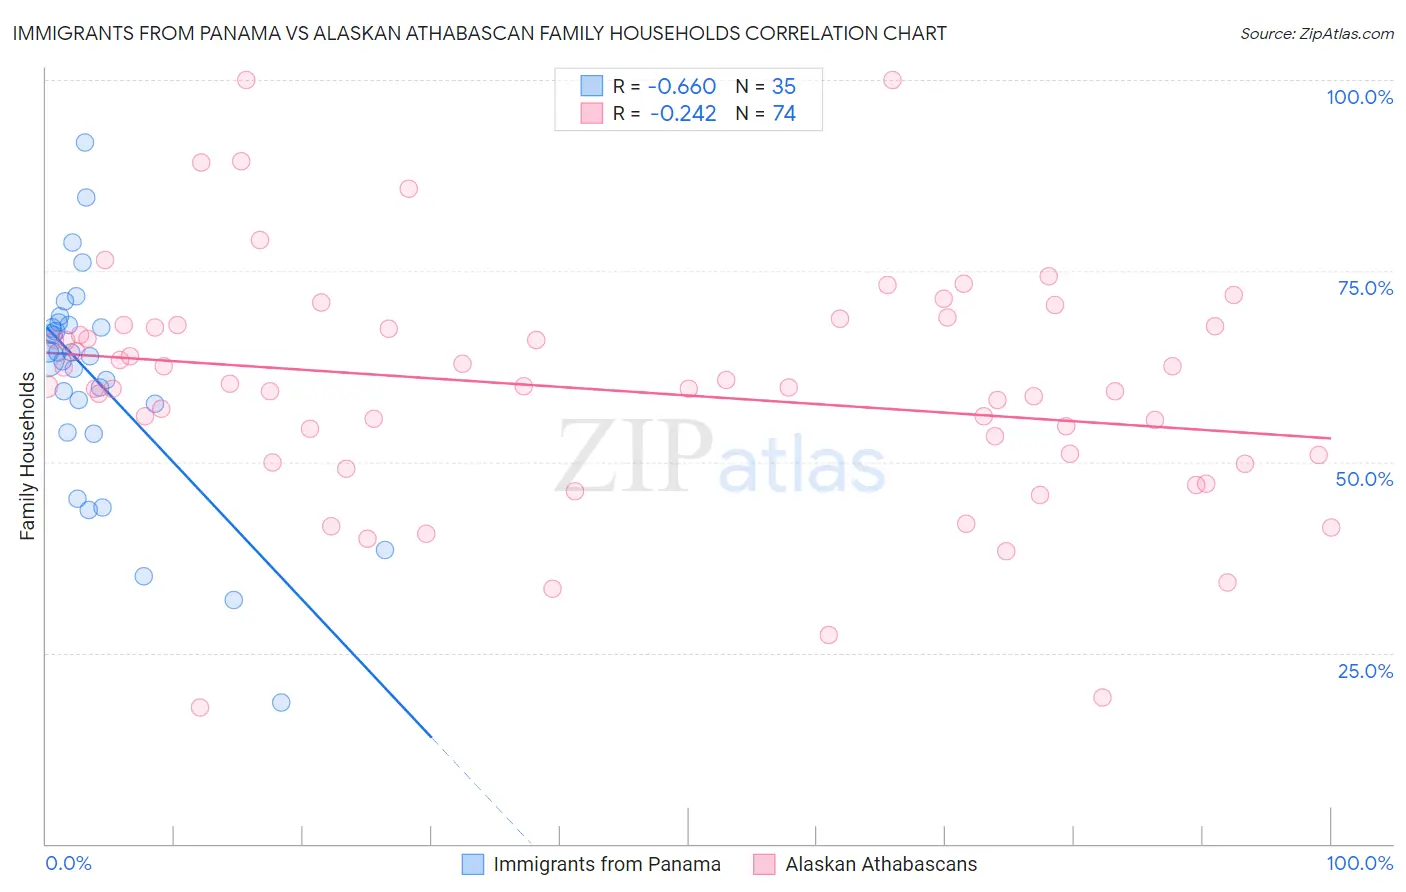
Immigrants from Panama vs Alaskan Athabascan Family Households Correlation Chart
The statistical analysis conducted on geographies consisting of 221,156,465 people shows a significant negative correlation between the proportion of Immigrants from Panama and percentage of family households in the United States with a correlation coefficient (R) of -0.660 and weighted average of 64.8%. Similarly, the statistical analysis conducted on geographies consisting of 45,815,060 people shows a weak negative correlation between the proportion of Alaskan Athabascans and percentage of family households in the United States with a correlation coefficient (R) of -0.242 and weighted average of 61.8%, a difference of 4.9%.
Family Households Correlation Summary
| Measurement | Immigrants from Panama | Alaskan Athabascan |
| Minimum | 18.6% | 17.8% |
| Maximum | 91.8% | 100.0% |
| Range | 73.2% | 82.2% |
| Mean | 60.6% | 59.5% |
| Median | 63.8% | 59.8% |
| Interquartile 25% (IQ1) | 53.8% | 50.9% |
| Interquartile 75% (IQ3) | 68.0% | 67.7% |
| Interquartile Range (IQR) | 14.2% | 16.7% |
| Standard Deviation (Sample) | 14.8% | 15.5% |
| Standard Deviation (Population) | 14.6% | 15.4% |
Similar Demographics by Family Households
Demographics Similar to Immigrants from Panama by Family Households
In terms of family households, the demographic groups most similar to Immigrants from Panama are Italian (64.8%, a difference of 0.010%), Panamanian (64.8%, a difference of 0.020%), Immigrants from Belize (64.9%, a difference of 0.030%), Immigrants from Ecuador (64.8%, a difference of 0.030%), and Immigrants from Argentina (64.9%, a difference of 0.040%).
| Demographics | Rating | Rank | Family Households |
| Immigrants | Oceania | 94.2 /100 | #120 | Exceptional 64.9% |
| Hungarians | 94.0 /100 | #121 | Exceptional 64.9% |
| Hmong | 93.4 /100 | #122 | Exceptional 64.9% |
| Choctaw | 93.4 /100 | #123 | Exceptional 64.9% |
| Immigrants | Argentina | 92.8 /100 | #124 | Exceptional 64.9% |
| Immigrants | Belize | 92.7 /100 | #125 | Exceptional 64.9% |
| Panamanians | 92.4 /100 | #126 | Exceptional 64.8% |
| Immigrants | Panama | 92.0 /100 | #127 | Exceptional 64.8% |
| Italians | 91.9 /100 | #128 | Exceptional 64.8% |
| Immigrants | Ecuador | 91.4 /100 | #129 | Exceptional 64.8% |
| Immigrants | Italy | 90.2 /100 | #130 | Exceptional 64.8% |
| Immigrants | Nonimmigrants | 90.1 /100 | #131 | Exceptional 64.8% |
| Cajuns | 89.4 /100 | #132 | Excellent 64.8% |
| Belizeans | 89.3 /100 | #133 | Excellent 64.8% |
| Greeks | 88.1 /100 | #134 | Excellent 64.7% |
Demographics Similar to Alaskan Athabascans by Family Households
In terms of family households, the demographic groups most similar to Alaskan Athabascans are Cape Verdean (61.8%, a difference of 0.060%), Immigrants from Bosnia and Herzegovina (61.9%, a difference of 0.080%), Immigrants from Middle Africa (61.9%, a difference of 0.12%), Moroccan (61.9%, a difference of 0.16%), and Ugandan (61.7%, a difference of 0.18%).
| Demographics | Rating | Rank | Family Households |
| Immigrants | Morocco | 0.0 /100 | #311 | Tragic 62.0% |
| Immigrants | Latvia | 0.0 /100 | #312 | Tragic 62.0% |
| Liberians | 0.0 /100 | #313 | Tragic 62.0% |
| Immigrants | Cabo Verde | 0.0 /100 | #314 | Tragic 61.9% |
| Moroccans | 0.0 /100 | #315 | Tragic 61.9% |
| Immigrants | Middle Africa | 0.0 /100 | #316 | Tragic 61.9% |
| Immigrants | Bosnia and Herzegovina | 0.0 /100 | #317 | Tragic 61.9% |
| Alaskan Athabascans | 0.0 /100 | #318 | Tragic 61.8% |
| Cape Verdeans | 0.0 /100 | #319 | Tragic 61.8% |
| Ugandans | 0.0 /100 | #320 | Tragic 61.7% |
| Alsatians | 0.0 /100 | #321 | Tragic 61.7% |
| Immigrants | Serbia | 0.0 /100 | #322 | Tragic 61.6% |
| Tlingit-Haida | 0.0 /100 | #323 | Tragic 61.6% |
| Immigrants | West Indies | 0.0 /100 | #324 | Tragic 61.6% |
| Immigrants | Switzerland | 0.0 /100 | #325 | Tragic 61.6% |