Immigrants from Panama vs Filipino Family Households
COMPARE
Immigrants from Panama
Filipino
Family Households
Family Households Comparison
Immigrants from Panama
Filipinos
64.8%
FAMILY HOUSEHOLDS
92.0/ 100
METRIC RATING
127th/ 347
METRIC RANK
65.9%
FAMILY HOUSEHOLDS
99.9/ 100
METRIC RATING
67th/ 347
METRIC RANK
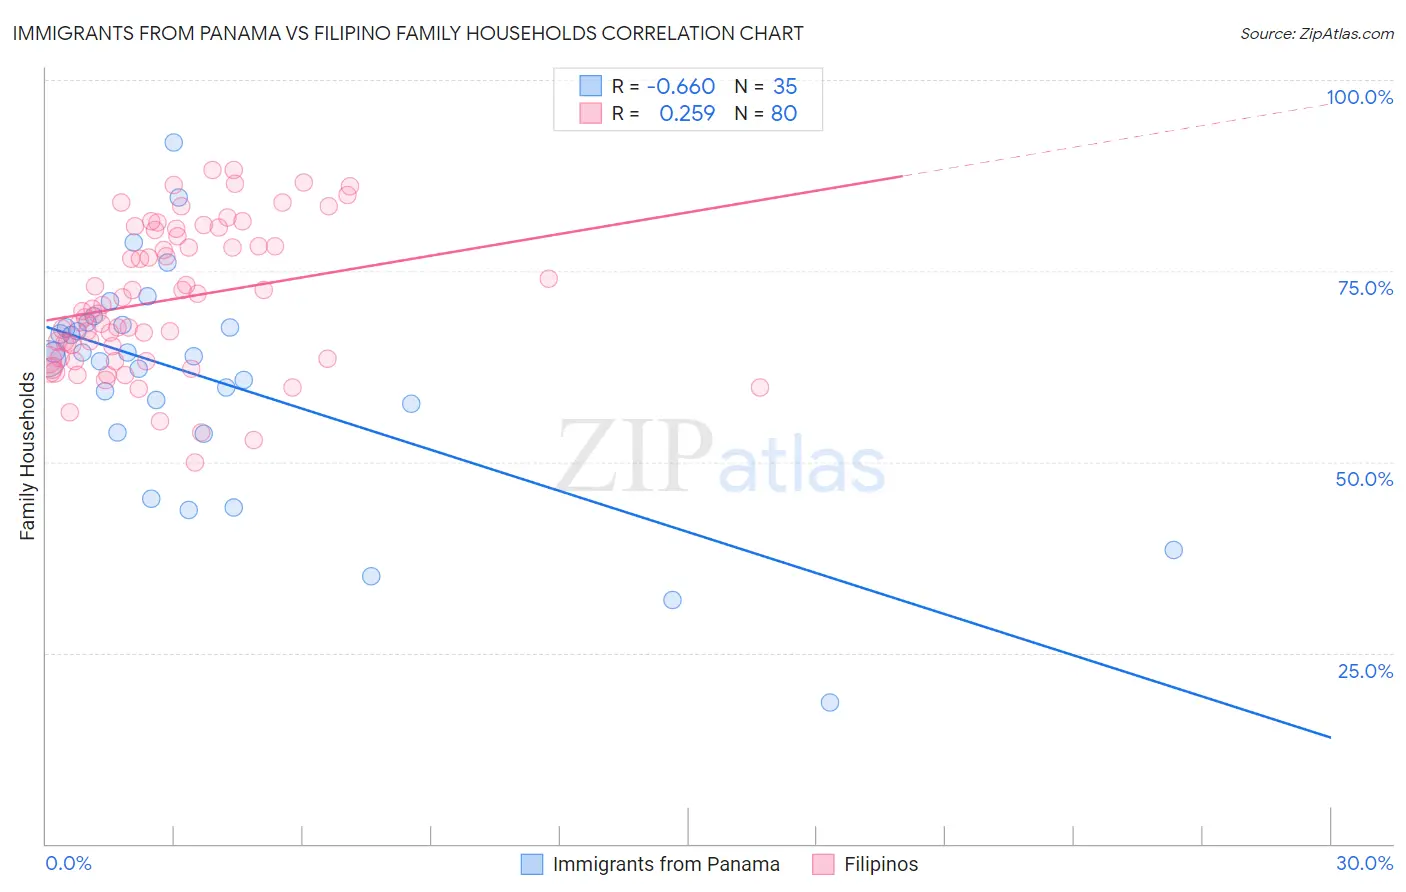
Immigrants from Panama vs Filipino Family Households Correlation Chart
The statistical analysis conducted on geographies consisting of 221,156,465 people shows a significant negative correlation between the proportion of Immigrants from Panama and percentage of family households in the United States with a correlation coefficient (R) of -0.660 and weighted average of 64.8%. Similarly, the statistical analysis conducted on geographies consisting of 254,177,261 people shows a weak positive correlation between the proportion of Filipinos and percentage of family households in the United States with a correlation coefficient (R) of 0.259 and weighted average of 65.9%, a difference of 1.7%.
Family Households Correlation Summary
| Measurement | Immigrants from Panama | Filipino |
| Minimum | 18.6% | 50.0% |
| Maximum | 91.8% | 88.3% |
| Range | 73.2% | 38.3% |
| Mean | 60.6% | 71.2% |
| Median | 63.8% | 69.9% |
| Interquartile 25% (IQ1) | 53.8% | 63.5% |
| Interquartile 75% (IQ3) | 68.0% | 80.0% |
| Interquartile Range (IQR) | 14.2% | 16.5% |
| Standard Deviation (Sample) | 14.8% | 9.4% |
| Standard Deviation (Population) | 14.6% | 9.4% |
Similar Demographics by Family Households
Demographics Similar to Immigrants from Panama by Family Households
In terms of family households, the demographic groups most similar to Immigrants from Panama are Italian (64.8%, a difference of 0.010%), Panamanian (64.8%, a difference of 0.020%), Immigrants from Belize (64.9%, a difference of 0.030%), Immigrants from Ecuador (64.8%, a difference of 0.030%), and Immigrants from Argentina (64.9%, a difference of 0.040%).
| Demographics | Rating | Rank | Family Households |
| Immigrants | Oceania | 94.2 /100 | #120 | Exceptional 64.9% |
| Hungarians | 94.0 /100 | #121 | Exceptional 64.9% |
| Hmong | 93.4 /100 | #122 | Exceptional 64.9% |
| Choctaw | 93.4 /100 | #123 | Exceptional 64.9% |
| Immigrants | Argentina | 92.8 /100 | #124 | Exceptional 64.9% |
| Immigrants | Belize | 92.7 /100 | #125 | Exceptional 64.9% |
| Panamanians | 92.4 /100 | #126 | Exceptional 64.8% |
| Immigrants | Panama | 92.0 /100 | #127 | Exceptional 64.8% |
| Italians | 91.9 /100 | #128 | Exceptional 64.8% |
| Immigrants | Ecuador | 91.4 /100 | #129 | Exceptional 64.8% |
| Immigrants | Italy | 90.2 /100 | #130 | Exceptional 64.8% |
| Immigrants | Nonimmigrants | 90.1 /100 | #131 | Exceptional 64.8% |
| Cajuns | 89.4 /100 | #132 | Excellent 64.8% |
| Belizeans | 89.3 /100 | #133 | Excellent 64.8% |
| Greeks | 88.1 /100 | #134 | Excellent 64.7% |
Demographics Similar to Filipinos by Family Households
In terms of family households, the demographic groups most similar to Filipinos are Fijian (65.9%, a difference of 0.0%), Japanese (65.9%, a difference of 0.020%), Costa Rican (65.9%, a difference of 0.040%), Pima (65.9%, a difference of 0.050%), and Malaysian (65.9%, a difference of 0.050%).
| Demographics | Rating | Rank | Family Households |
| South Americans | 100.0 /100 | #60 | Exceptional 66.0% |
| Danes | 100.0 /100 | #61 | Exceptional 66.0% |
| Central Americans | 100.0 /100 | #62 | Exceptional 66.0% |
| Immigrants | Indonesia | 100.0 /100 | #63 | Exceptional 66.0% |
| Pima | 99.9 /100 | #64 | Exceptional 65.9% |
| Costa Ricans | 99.9 /100 | #65 | Exceptional 65.9% |
| Fijians | 99.9 /100 | #66 | Exceptional 65.9% |
| Filipinos | 99.9 /100 | #67 | Exceptional 65.9% |
| Japanese | 99.9 /100 | #68 | Exceptional 65.9% |
| Malaysians | 99.9 /100 | #69 | Exceptional 65.9% |
| Immigrants | Afghanistan | 99.9 /100 | #70 | Exceptional 65.9% |
| Bhutanese | 99.9 /100 | #71 | Exceptional 65.9% |
| Portuguese | 99.9 /100 | #72 | Exceptional 65.8% |
| Laotians | 99.9 /100 | #73 | Exceptional 65.8% |
| Burmese | 99.9 /100 | #74 | Exceptional 65.7% |