Immigrants from Latvia vs Tsimshian Family Households
COMPARE
Immigrants from Latvia
Tsimshian
Family Households
Family Households Comparison
Immigrants from Latvia
Tsimshian
62.0%
FAMILY HOUSEHOLDS
0.0/ 100
METRIC RATING
312th/ 347
METRIC RANK
67.1%
FAMILY HOUSEHOLDS
100.0/ 100
METRIC RATING
37th/ 347
METRIC RANK
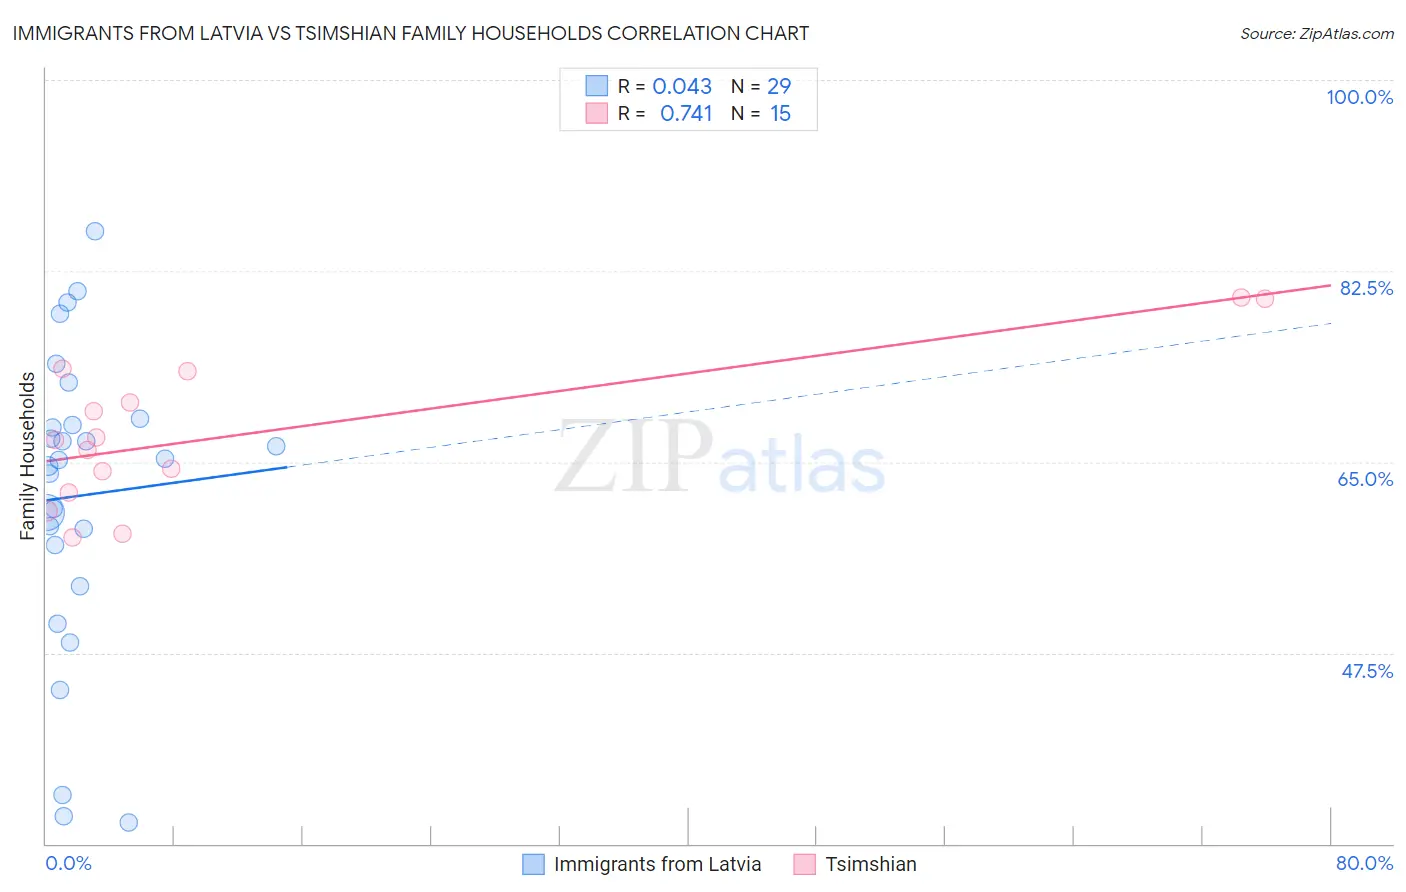
Immigrants from Latvia vs Tsimshian Family Households Correlation Chart
The statistical analysis conducted on geographies consisting of 113,726,313 people shows no correlation between the proportion of Immigrants from Latvia and percentage of family households in the United States with a correlation coefficient (R) of 0.043 and weighted average of 62.0%. Similarly, the statistical analysis conducted on geographies consisting of 15,626,544 people shows a strong positive correlation between the proportion of Tsimshian and percentage of family households in the United States with a correlation coefficient (R) of 0.741 and weighted average of 67.1%, a difference of 8.2%.
Family Households Correlation Summary
| Measurement | Immigrants from Latvia | Tsimshian |
| Minimum | 31.9% | 58.0% |
| Maximum | 86.2% | 80.1% |
| Range | 54.2% | 22.1% |
| Mean | 61.9% | 67.7% |
| Median | 65.2% | 67.0% |
| Interquartile 25% (IQ1) | 55.5% | 62.2% |
| Interquartile 75% (IQ3) | 68.7% | 73.3% |
| Interquartile Range (IQR) | 13.2% | 11.1% |
| Standard Deviation (Sample) | 13.8% | 6.9% |
| Standard Deviation (Population) | 13.5% | 6.7% |
Similar Demographics by Family Households
Demographics Similar to Immigrants from Latvia by Family Households
In terms of family households, the demographic groups most similar to Immigrants from Latvia are Liberian (62.0%, a difference of 0.010%), Immigrants from Morocco (62.0%, a difference of 0.050%), Immigrants from Cabo Verde (61.9%, a difference of 0.060%), Immigrants from Liberia (62.0%, a difference of 0.080%), and Moroccan (61.9%, a difference of 0.10%).
| Demographics | Rating | Rank | Family Households |
| Bermudans | 0.0 /100 | #305 | Tragic 62.2% |
| Africans | 0.0 /100 | #306 | Tragic 62.1% |
| Immigrants | Norway | 0.0 /100 | #307 | Tragic 62.1% |
| Chippewa | 0.0 /100 | #308 | Tragic 62.1% |
| Sub-Saharan Africans | 0.0 /100 | #309 | Tragic 62.1% |
| Immigrants | Liberia | 0.0 /100 | #310 | Tragic 62.0% |
| Immigrants | Morocco | 0.0 /100 | #311 | Tragic 62.0% |
| Immigrants | Latvia | 0.0 /100 | #312 | Tragic 62.0% |
| Liberians | 0.0 /100 | #313 | Tragic 62.0% |
| Immigrants | Cabo Verde | 0.0 /100 | #314 | Tragic 61.9% |
| Moroccans | 0.0 /100 | #315 | Tragic 61.9% |
| Immigrants | Middle Africa | 0.0 /100 | #316 | Tragic 61.9% |
| Immigrants | Bosnia and Herzegovina | 0.0 /100 | #317 | Tragic 61.9% |
| Alaskan Athabascans | 0.0 /100 | #318 | Tragic 61.8% |
| Cape Verdeans | 0.0 /100 | #319 | Tragic 61.8% |
Demographics Similar to Tsimshian by Family Households
In terms of family households, the demographic groups most similar to Tsimshian are Peruvian (67.1%, a difference of 0.070%), Tohono O'odham (67.1%, a difference of 0.080%), Mexican American Indian (67.0%, a difference of 0.10%), Immigrants from El Salvador (67.0%, a difference of 0.12%), and Salvadoran (67.2%, a difference of 0.13%).
| Demographics | Rating | Rank | Family Households |
| Immigrants | Peru | 100.0 /100 | #30 | Exceptional 67.2% |
| Immigrants | Latin America | 100.0 /100 | #31 | Exceptional 67.2% |
| Nepalese | 100.0 /100 | #32 | Exceptional 67.2% |
| Salvadorans | 100.0 /100 | #33 | Exceptional 67.2% |
| Thais | 100.0 /100 | #34 | Exceptional 67.2% |
| Tohono O'odham | 100.0 /100 | #35 | Exceptional 67.1% |
| Peruvians | 100.0 /100 | #36 | Exceptional 67.1% |
| Tsimshian | 100.0 /100 | #37 | Exceptional 67.1% |
| Mexican American Indians | 100.0 /100 | #38 | Exceptional 67.0% |
| Immigrants | El Salvador | 100.0 /100 | #39 | Exceptional 67.0% |
| Guamanians/Chamorros | 100.0 /100 | #40 | Exceptional 66.6% |
| Immigrants | Bolivia | 100.0 /100 | #41 | Exceptional 66.6% |
| Menominee | 100.0 /100 | #42 | Exceptional 66.5% |
| Apache | 100.0 /100 | #43 | Exceptional 66.5% |
| Asians | 100.0 /100 | #44 | Exceptional 66.5% |