Immigrants from Latvia vs Tsimshian Hearing Disability
COMPARE
Immigrants from Latvia
Tsimshian
Hearing Disability
Hearing Disability Comparison
Immigrants from Latvia
Tsimshian
3.1%
HEARING DISABILITY
12.7/ 100
METRIC RATING
208th/ 347
METRIC RANK
4.7%
HEARING DISABILITY
0.0/ 100
METRIC RATING
342nd/ 347
METRIC RANK
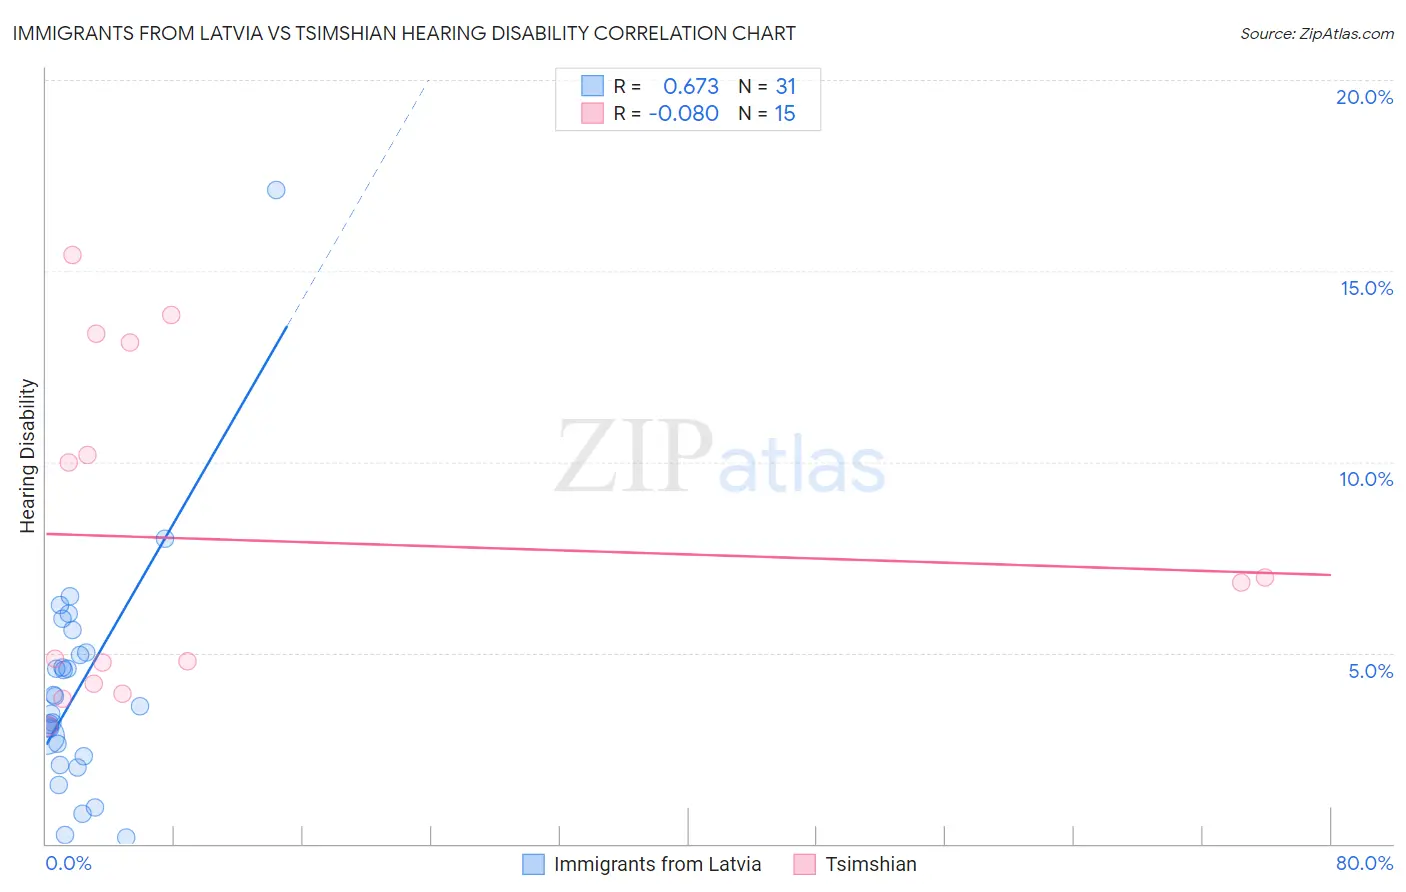
Immigrants from Latvia vs Tsimshian Hearing Disability Correlation Chart
The statistical analysis conducted on geographies consisting of 113,736,493 people shows a significant positive correlation between the proportion of Immigrants from Latvia and percentage of population with hearing disability in the United States with a correlation coefficient (R) of 0.673 and weighted average of 3.1%. Similarly, the statistical analysis conducted on geographies consisting of 15,626,462 people shows a slight negative correlation between the proportion of Tsimshian and percentage of population with hearing disability in the United States with a correlation coefficient (R) of -0.080 and weighted average of 4.7%, a difference of 50.3%.
Hearing Disability Correlation Summary
| Measurement | Immigrants from Latvia | Tsimshian |
| Minimum | 0.16% | 3.1% |
| Maximum | 17.1% | 15.4% |
| Range | 17.0% | 12.3% |
| Mean | 4.1% | 7.9% |
| Median | 3.6% | 6.8% |
| Interquartile 25% (IQ1) | 2.3% | 4.2% |
| Interquartile 75% (IQ3) | 5.0% | 13.1% |
| Interquartile Range (IQR) | 2.7% | 8.9% |
| Standard Deviation (Sample) | 3.1% | 4.3% |
| Standard Deviation (Population) | 3.0% | 4.2% |
Similar Demographics by Hearing Disability
Demographics Similar to Immigrants from Latvia by Hearing Disability
In terms of hearing disability, the demographic groups most similar to Immigrants from Latvia are Immigrants from Hungary (3.1%, a difference of 0.040%), Cape Verdean (3.1%, a difference of 0.090%), Romanian (3.1%, a difference of 0.13%), Pakistani (3.1%, a difference of 0.33%), and Hispanic or Latino (3.1%, a difference of 0.46%).
| Demographics | Rating | Rank | Hearing Disability |
| Iraqis | 19.0 /100 | #201 | Poor 3.1% |
| Immigrants | Thailand | 16.4 /100 | #202 | Poor 3.1% |
| Immigrants | Denmark | 16.2 /100 | #203 | Poor 3.1% |
| Immigrants | Czechoslovakia | 15.9 /100 | #204 | Poor 3.1% |
| Alsatians | 15.9 /100 | #205 | Poor 3.1% |
| Eastern Europeans | 15.5 /100 | #206 | Poor 3.1% |
| Hispanics or Latinos | 15.1 /100 | #207 | Poor 3.1% |
| Immigrants | Latvia | 12.7 /100 | #208 | Poor 3.1% |
| Immigrants | Hungary | 12.5 /100 | #209 | Poor 3.1% |
| Cape Verdeans | 12.2 /100 | #210 | Poor 3.1% |
| Romanians | 12.1 /100 | #211 | Poor 3.1% |
| Pakistanis | 11.1 /100 | #212 | Poor 3.1% |
| Immigrants | Iraq | 10.5 /100 | #213 | Poor 3.1% |
| Australians | 8.1 /100 | #214 | Tragic 3.2% |
| Bangladeshis | 8.1 /100 | #215 | Tragic 3.2% |
Demographics Similar to Tsimshian by Hearing Disability
In terms of hearing disability, the demographic groups most similar to Tsimshian are Inupiat (4.7%, a difference of 0.21%), Navajo (4.6%, a difference of 1.5%), Pueblo (4.6%, a difference of 1.9%), Tlingit-Haida (4.8%, a difference of 2.9%), and Choctaw (4.5%, a difference of 3.4%).
| Demographics | Rating | Rank | Hearing Disability |
| Dutch West Indians | 0.0 /100 | #333 | Tragic 4.3% |
| Aleuts | 0.0 /100 | #334 | Tragic 4.3% |
| Kiowa | 0.0 /100 | #335 | Tragic 4.3% |
| Creek | 0.0 /100 | #336 | Tragic 4.4% |
| Chickasaw | 0.0 /100 | #337 | Tragic 4.5% |
| Alaska Natives | 0.0 /100 | #338 | Tragic 4.5% |
| Choctaw | 0.0 /100 | #339 | Tragic 4.5% |
| Pueblo | 0.0 /100 | #340 | Tragic 4.6% |
| Navajo | 0.0 /100 | #341 | Tragic 4.6% |
| Tsimshian | 0.0 /100 | #342 | Tragic 4.7% |
| Inupiat | 0.0 /100 | #343 | Tragic 4.7% |
| Tlingit-Haida | 0.0 /100 | #344 | Tragic 4.8% |
| Alaskan Athabascans | 0.0 /100 | #345 | Tragic 5.3% |
| Colville | 0.0 /100 | #346 | Tragic 5.3% |
| Yup'ik | 0.0 /100 | #347 | Tragic 5.8% |