Immigrants from Sierra Leone vs Tsimshian Family Households
COMPARE
Immigrants from Sierra Leone
Tsimshian
Family Households
Family Households Comparison
Immigrants from Sierra Leone
Tsimshian
64.3%
FAMILY HOUSEHOLDS
52.5/ 100
METRIC RATING
173rd/ 347
METRIC RANK
67.1%
FAMILY HOUSEHOLDS
100.0/ 100
METRIC RATING
37th/ 347
METRIC RANK
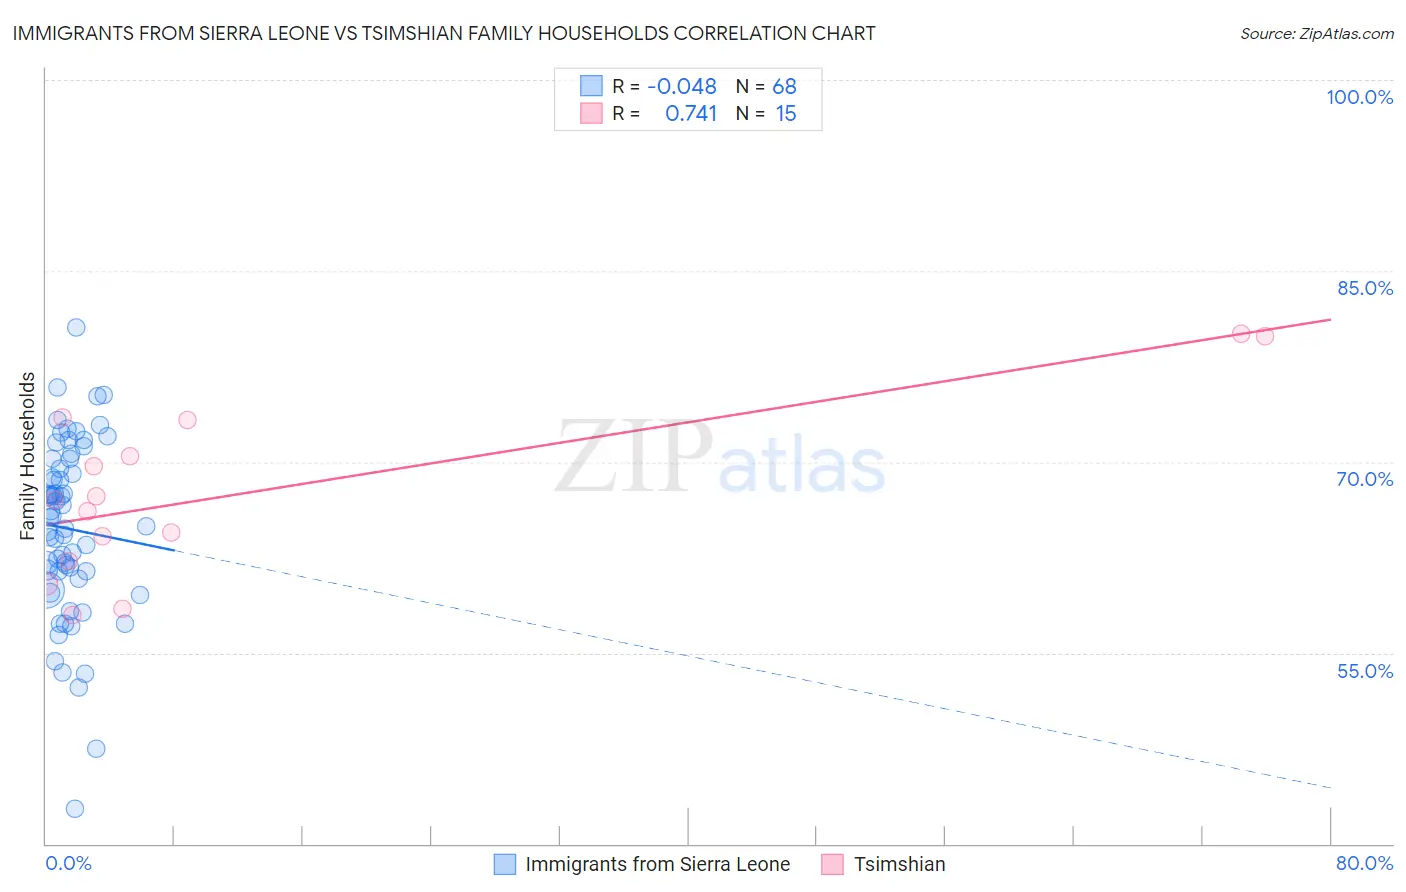
Immigrants from Sierra Leone vs Tsimshian Family Households Correlation Chart
The statistical analysis conducted on geographies consisting of 101,647,201 people shows no correlation between the proportion of Immigrants from Sierra Leone and percentage of family households in the United States with a correlation coefficient (R) of -0.048 and weighted average of 64.3%. Similarly, the statistical analysis conducted on geographies consisting of 15,626,544 people shows a strong positive correlation between the proportion of Tsimshian and percentage of family households in the United States with a correlation coefficient (R) of 0.741 and weighted average of 67.1%, a difference of 4.3%.
Family Households Correlation Summary
| Measurement | Immigrants from Sierra Leone | Tsimshian |
| Minimum | 42.7% | 58.0% |
| Maximum | 80.6% | 80.1% |
| Range | 37.9% | 22.1% |
| Mean | 64.7% | 67.7% |
| Median | 65.3% | 67.0% |
| Interquartile 25% (IQ1) | 61.1% | 62.2% |
| Interquartile 75% (IQ3) | 69.8% | 73.3% |
| Interquartile Range (IQR) | 8.7% | 11.1% |
| Standard Deviation (Sample) | 7.0% | 6.9% |
| Standard Deviation (Population) | 6.9% | 6.7% |
Similar Demographics by Family Households
Demographics Similar to Immigrants from Sierra Leone by Family Households
In terms of family households, the demographic groups most similar to Immigrants from Sierra Leone are Dutch West Indian (64.3%, a difference of 0.020%), Ute (64.3%, a difference of 0.030%), Immigrants from Germany (64.3%, a difference of 0.030%), Iraqi (64.4%, a difference of 0.050%), and Armenian (64.4%, a difference of 0.050%).
| Demographics | Rating | Rank | Family Households |
| Scotch-Irish | 59.2 /100 | #166 | Average 64.4% |
| Irish | 57.9 /100 | #167 | Average 64.4% |
| Hondurans | 57.5 /100 | #168 | Average 64.4% |
| Iraqis | 56.0 /100 | #169 | Average 64.4% |
| Armenians | 55.9 /100 | #170 | Average 64.4% |
| Ute | 54.6 /100 | #171 | Average 64.3% |
| Dutch West Indians | 53.9 /100 | #172 | Average 64.3% |
| Immigrants | Sierra Leone | 52.5 /100 | #173 | Average 64.3% |
| Immigrants | Germany | 50.0 /100 | #174 | Average 64.3% |
| Bangladeshis | 44.3 /100 | #175 | Average 64.3% |
| Vietnamese | 43.6 /100 | #176 | Average 64.2% |
| Immigrants | Micronesia | 42.3 /100 | #177 | Average 64.2% |
| Jamaicans | 40.6 /100 | #178 | Average 64.2% |
| Immigrants | Ukraine | 38.2 /100 | #179 | Fair 64.2% |
| Immigrants | Honduras | 35.0 /100 | #180 | Fair 64.2% |
Demographics Similar to Tsimshian by Family Households
In terms of family households, the demographic groups most similar to Tsimshian are Peruvian (67.1%, a difference of 0.070%), Tohono O'odham (67.1%, a difference of 0.080%), Mexican American Indian (67.0%, a difference of 0.10%), Immigrants from El Salvador (67.0%, a difference of 0.12%), and Salvadoran (67.2%, a difference of 0.13%).
| Demographics | Rating | Rank | Family Households |
| Immigrants | Peru | 100.0 /100 | #30 | Exceptional 67.2% |
| Immigrants | Latin America | 100.0 /100 | #31 | Exceptional 67.2% |
| Nepalese | 100.0 /100 | #32 | Exceptional 67.2% |
| Salvadorans | 100.0 /100 | #33 | Exceptional 67.2% |
| Thais | 100.0 /100 | #34 | Exceptional 67.2% |
| Tohono O'odham | 100.0 /100 | #35 | Exceptional 67.1% |
| Peruvians | 100.0 /100 | #36 | Exceptional 67.1% |
| Tsimshian | 100.0 /100 | #37 | Exceptional 67.1% |
| Mexican American Indians | 100.0 /100 | #38 | Exceptional 67.0% |
| Immigrants | El Salvador | 100.0 /100 | #39 | Exceptional 67.0% |
| Guamanians/Chamorros | 100.0 /100 | #40 | Exceptional 66.6% |
| Immigrants | Bolivia | 100.0 /100 | #41 | Exceptional 66.6% |
| Menominee | 100.0 /100 | #42 | Exceptional 66.5% |
| Apache | 100.0 /100 | #43 | Exceptional 66.5% |
| Asians | 100.0 /100 | #44 | Exceptional 66.5% |