Immigrants from Latvia vs Jamaican Family Households
COMPARE
Immigrants from Latvia
Jamaican
Family Households
Family Households Comparison
Immigrants from Latvia
Jamaicans
62.0%
FAMILY HOUSEHOLDS
0.0/ 100
METRIC RATING
312th/ 347
METRIC RANK
64.2%
FAMILY HOUSEHOLDS
40.6/ 100
METRIC RATING
178th/ 347
METRIC RANK
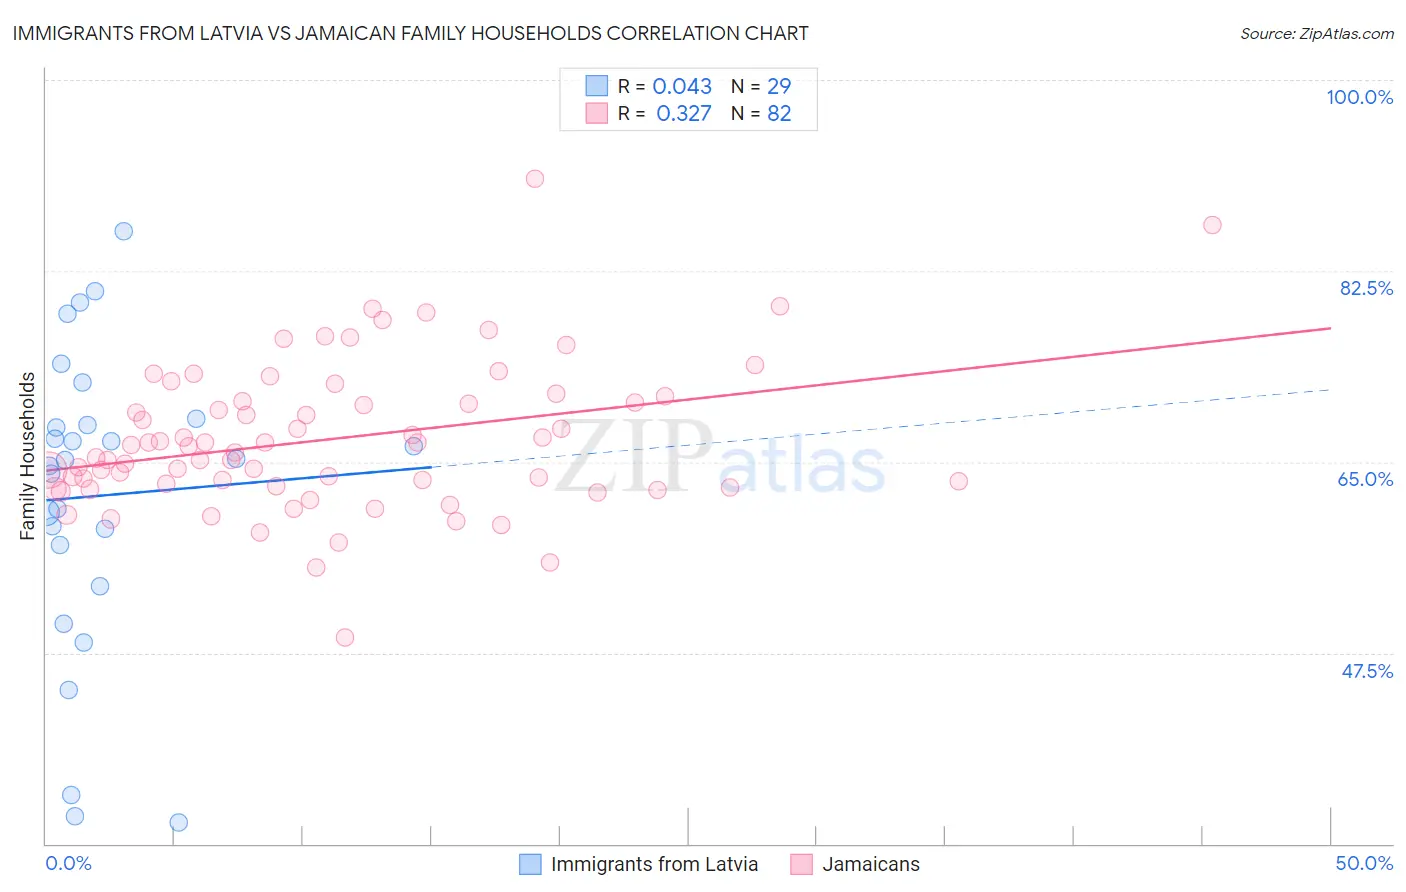
Immigrants from Latvia vs Jamaican Family Households Correlation Chart
The statistical analysis conducted on geographies consisting of 113,726,313 people shows no correlation between the proportion of Immigrants from Latvia and percentage of family households in the United States with a correlation coefficient (R) of 0.043 and weighted average of 62.0%. Similarly, the statistical analysis conducted on geographies consisting of 367,646,383 people shows a mild positive correlation between the proportion of Jamaicans and percentage of family households in the United States with a correlation coefficient (R) of 0.327 and weighted average of 64.2%, a difference of 3.6%.
Family Households Correlation Summary
| Measurement | Immigrants from Latvia | Jamaican |
| Minimum | 31.9% | 48.9% |
| Maximum | 86.2% | 91.0% |
| Range | 54.2% | 42.1% |
| Mean | 61.9% | 67.1% |
| Median | 65.2% | 66.2% |
| Interquartile 25% (IQ1) | 55.5% | 62.7% |
| Interquartile 75% (IQ3) | 68.7% | 70.6% |
| Interquartile Range (IQR) | 13.2% | 7.9% |
| Standard Deviation (Sample) | 13.8% | 6.8% |
| Standard Deviation (Population) | 13.5% | 6.8% |
Similar Demographics by Family Households
Demographics Similar to Immigrants from Latvia by Family Households
In terms of family households, the demographic groups most similar to Immigrants from Latvia are Liberian (62.0%, a difference of 0.010%), Immigrants from Morocco (62.0%, a difference of 0.050%), Immigrants from Cabo Verde (61.9%, a difference of 0.060%), Immigrants from Liberia (62.0%, a difference of 0.080%), and Moroccan (61.9%, a difference of 0.10%).
| Demographics | Rating | Rank | Family Households |
| Bermudans | 0.0 /100 | #305 | Tragic 62.2% |
| Africans | 0.0 /100 | #306 | Tragic 62.1% |
| Immigrants | Norway | 0.0 /100 | #307 | Tragic 62.1% |
| Chippewa | 0.0 /100 | #308 | Tragic 62.1% |
| Sub-Saharan Africans | 0.0 /100 | #309 | Tragic 62.1% |
| Immigrants | Liberia | 0.0 /100 | #310 | Tragic 62.0% |
| Immigrants | Morocco | 0.0 /100 | #311 | Tragic 62.0% |
| Immigrants | Latvia | 0.0 /100 | #312 | Tragic 62.0% |
| Liberians | 0.0 /100 | #313 | Tragic 62.0% |
| Immigrants | Cabo Verde | 0.0 /100 | #314 | Tragic 61.9% |
| Moroccans | 0.0 /100 | #315 | Tragic 61.9% |
| Immigrants | Middle Africa | 0.0 /100 | #316 | Tragic 61.9% |
| Immigrants | Bosnia and Herzegovina | 0.0 /100 | #317 | Tragic 61.9% |
| Alaskan Athabascans | 0.0 /100 | #318 | Tragic 61.8% |
| Cape Verdeans | 0.0 /100 | #319 | Tragic 61.8% |
Demographics Similar to Jamaicans by Family Households
In terms of family households, the demographic groups most similar to Jamaicans are Immigrants from Micronesia (64.2%, a difference of 0.020%), Immigrants from Ukraine (64.2%, a difference of 0.030%), Vietnamese (64.2%, a difference of 0.040%), Bangladeshi (64.3%, a difference of 0.050%), and Immigrants from Honduras (64.2%, a difference of 0.080%).
| Demographics | Rating | Rank | Family Households |
| Ute | 54.6 /100 | #171 | Average 64.3% |
| Dutch West Indians | 53.9 /100 | #172 | Average 64.3% |
| Immigrants | Sierra Leone | 52.5 /100 | #173 | Average 64.3% |
| Immigrants | Germany | 50.0 /100 | #174 | Average 64.3% |
| Bangladeshis | 44.3 /100 | #175 | Average 64.3% |
| Vietnamese | 43.6 /100 | #176 | Average 64.2% |
| Immigrants | Micronesia | 42.3 /100 | #177 | Average 64.2% |
| Jamaicans | 40.6 /100 | #178 | Average 64.2% |
| Immigrants | Ukraine | 38.2 /100 | #179 | Fair 64.2% |
| Immigrants | Honduras | 35.0 /100 | #180 | Fair 64.2% |
| Immigrants | Trinidad and Tobago | 34.9 /100 | #181 | Fair 64.2% |
| Ukrainians | 34.6 /100 | #182 | Fair 64.2% |
| Creek | 34.1 /100 | #183 | Fair 64.2% |
| Puerto Ricans | 33.4 /100 | #184 | Fair 64.2% |
| Immigrants | Iran | 30.4 /100 | #185 | Fair 64.1% |