Czechoslovakian vs Tsimshian Family Households
COMPARE
Czechoslovakian
Tsimshian
Family Households
Family Households Comparison
Czechoslovakians
Tsimshian
64.6%
FAMILY HOUSEHOLDS
82.1/ 100
METRIC RATING
143rd/ 347
METRIC RANK
67.1%
FAMILY HOUSEHOLDS
100.0/ 100
METRIC RATING
37th/ 347
METRIC RANK
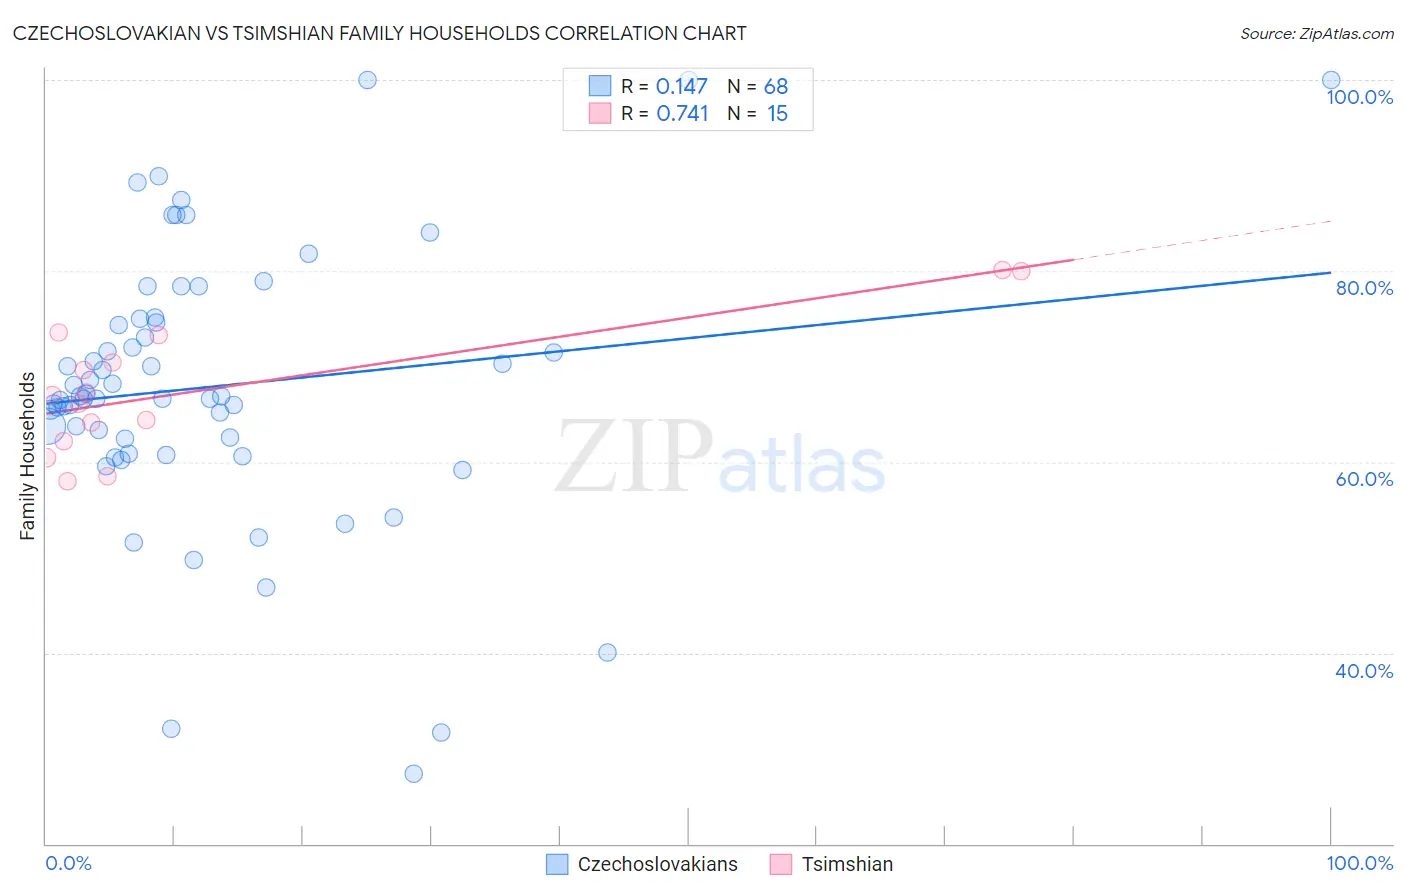
Czechoslovakian vs Tsimshian Family Households Correlation Chart
The statistical analysis conducted on geographies consisting of 368,525,502 people shows a poor positive correlation between the proportion of Czechoslovakians and percentage of family households in the United States with a correlation coefficient (R) of 0.147 and weighted average of 64.6%. Similarly, the statistical analysis conducted on geographies consisting of 15,626,544 people shows a strong positive correlation between the proportion of Tsimshian and percentage of family households in the United States with a correlation coefficient (R) of 0.741 and weighted average of 67.1%, a difference of 3.8%.
Family Households Correlation Summary
| Measurement | Czechoslovakian | Tsimshian |
| Minimum | 27.4% | 58.0% |
| Maximum | 100.0% | 80.1% |
| Range | 72.6% | 22.1% |
| Mean | 67.9% | 67.7% |
| Median | 66.7% | 67.0% |
| Interquartile 25% (IQ1) | 61.6% | 62.2% |
| Interquartile 75% (IQ3) | 74.8% | 73.3% |
| Interquartile Range (IQR) | 13.1% | 11.1% |
| Standard Deviation (Sample) | 14.4% | 6.9% |
| Standard Deviation (Population) | 14.3% | 6.7% |
Similar Demographics by Family Households
Demographics Similar to Czechoslovakians by Family Households
In terms of family households, the demographic groups most similar to Czechoslovakians are South American Indian (64.6%, a difference of 0.0%), Welsh (64.6%, a difference of 0.040%), Pakistani (64.7%, a difference of 0.050%), Immigrants from North Macedonia (64.7%, a difference of 0.070%), and Immigrants from Cameroon (64.7%, a difference of 0.070%).
| Demographics | Rating | Rank | Family Households |
| Immigrants | China | 86.6 /100 | #136 | Excellent 64.7% |
| Immigrants | Scotland | 86.4 /100 | #137 | Excellent 64.7% |
| Basques | 85.5 /100 | #138 | Excellent 64.7% |
| Immigrants | Jamaica | 85.3 /100 | #139 | Excellent 64.7% |
| Immigrants | North Macedonia | 84.9 /100 | #140 | Excellent 64.7% |
| Immigrants | Cameroon | 84.8 /100 | #141 | Excellent 64.7% |
| Pakistanis | 84.0 /100 | #142 | Excellent 64.7% |
| Czechoslovakians | 82.1 /100 | #143 | Excellent 64.6% |
| South American Indians | 81.9 /100 | #144 | Excellent 64.6% |
| Welsh | 80.1 /100 | #145 | Excellent 64.6% |
| Immigrants | Romania | 77.0 /100 | #146 | Good 64.6% |
| Immigrants | Chile | 76.5 /100 | #147 | Good 64.6% |
| Delaware | 76.3 /100 | #148 | Good 64.6% |
| Sioux | 76.3 /100 | #149 | Good 64.6% |
| Romanians | 75.3 /100 | #150 | Good 64.5% |
Demographics Similar to Tsimshian by Family Households
In terms of family households, the demographic groups most similar to Tsimshian are Peruvian (67.1%, a difference of 0.070%), Tohono O'odham (67.1%, a difference of 0.080%), Mexican American Indian (67.0%, a difference of 0.10%), Immigrants from El Salvador (67.0%, a difference of 0.12%), and Salvadoran (67.2%, a difference of 0.13%).
| Demographics | Rating | Rank | Family Households |
| Immigrants | Peru | 100.0 /100 | #30 | Exceptional 67.2% |
| Immigrants | Latin America | 100.0 /100 | #31 | Exceptional 67.2% |
| Nepalese | 100.0 /100 | #32 | Exceptional 67.2% |
| Salvadorans | 100.0 /100 | #33 | Exceptional 67.2% |
| Thais | 100.0 /100 | #34 | Exceptional 67.2% |
| Tohono O'odham | 100.0 /100 | #35 | Exceptional 67.1% |
| Peruvians | 100.0 /100 | #36 | Exceptional 67.1% |
| Tsimshian | 100.0 /100 | #37 | Exceptional 67.1% |
| Mexican American Indians | 100.0 /100 | #38 | Exceptional 67.0% |
| Immigrants | El Salvador | 100.0 /100 | #39 | Exceptional 67.0% |
| Guamanians/Chamorros | 100.0 /100 | #40 | Exceptional 66.6% |
| Immigrants | Bolivia | 100.0 /100 | #41 | Exceptional 66.6% |
| Menominee | 100.0 /100 | #42 | Exceptional 66.5% |
| Apache | 100.0 /100 | #43 | Exceptional 66.5% |
| Asians | 100.0 /100 | #44 | Exceptional 66.5% |