Immigrants from Latvia vs Tsimshian Unemployment Among Women with Children Ages 6 to 17 years
COMPARE
Immigrants from Latvia
Tsimshian
Unemployment Among Women with Children Ages 6 to 17 years
Unemployment Among Women with Children Ages 6 to 17 years Comparison
Immigrants from Latvia
Tsimshian
8.7%
UNEMPLOYMENT AMONG WOMEN WITH CHILDREN AGES 6 TO 17 YEARS
90.4/ 100
METRIC RATING
136th/ 347
METRIC RANK
11.4%
UNEMPLOYMENT AMONG WOMEN WITH CHILDREN AGES 6 TO 17 YEARS
0.0/ 100
METRIC RATING
332nd/ 347
METRIC RANK
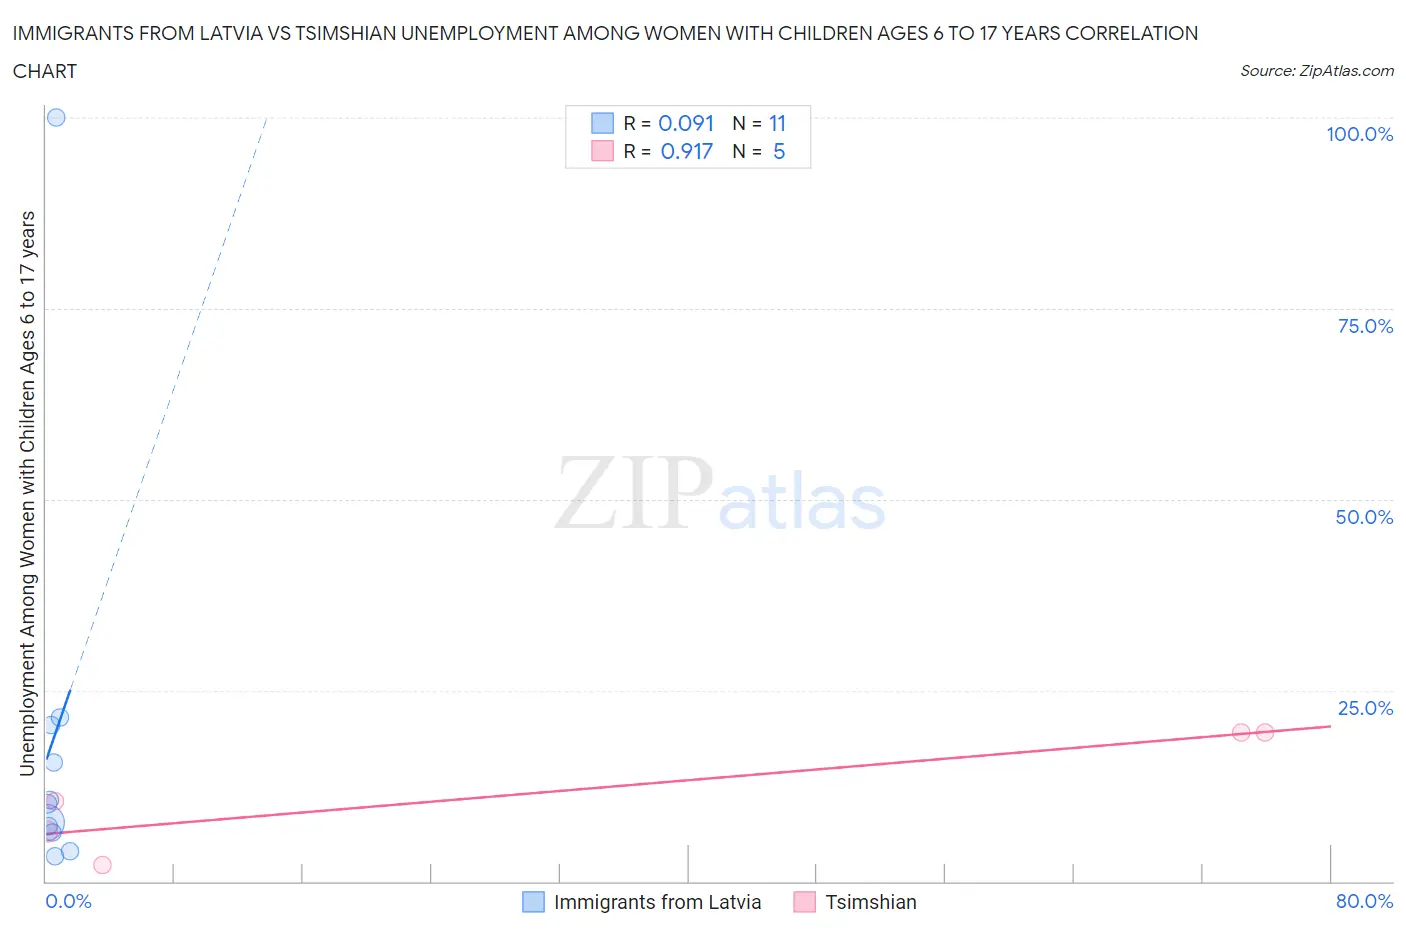
Immigrants from Latvia vs Tsimshian Unemployment Among Women with Children Ages 6 to 17 years Correlation Chart
The statistical analysis conducted on geographies consisting of 95,427,578 people shows a slight positive correlation between the proportion of Immigrants from Latvia and unemployment rate among women with children between the ages 6 and 17 in the United States with a correlation coefficient (R) of 0.091 and weighted average of 8.7%. Similarly, the statistical analysis conducted on geographies consisting of 14,078,831 people shows a near-perfect positive correlation between the proportion of Tsimshian and unemployment rate among women with children between the ages 6 and 17 in the United States with a correlation coefficient (R) of 0.917 and weighted average of 11.4%, a difference of 30.3%.
Unemployment Among Women with Children Ages 6 to 17 years Correlation Summary
| Measurement | Immigrants from Latvia | Tsimshian |
| Minimum | 3.3% | 2.2% |
| Maximum | 100.0% | 19.5% |
| Range | 96.7% | 17.3% |
| Mean | 18.8% | 11.6% |
| Median | 10.2% | 10.4% |
| Interquartile 25% (IQ1) | 6.4% | 4.3% |
| Interquartile 75% (IQ3) | 20.4% | 19.5% |
| Interquartile Range (IQR) | 14.1% | 15.2% |
| Standard Deviation (Sample) | 27.6% | 7.8% |
| Standard Deviation (Population) | 26.3% | 6.9% |
Similar Demographics by Unemployment Among Women with Children Ages 6 to 17 years
Demographics Similar to Immigrants from Latvia by Unemployment Among Women with Children Ages 6 to 17 years
In terms of unemployment among women with children ages 6 to 17 years, the demographic groups most similar to Immigrants from Latvia are European (8.7%, a difference of 0.030%), Immigrants from Argentina (8.7%, a difference of 0.050%), Immigrants from Ireland (8.7%, a difference of 0.090%), Immigrants from Ethiopia (8.8%, a difference of 0.11%), and Northern European (8.8%, a difference of 0.14%).
| Demographics | Rating | Rank | Unemployment Among Women with Children Ages 6 to 17 years |
| Barbadians | 93.8 /100 | #129 | Exceptional 8.7% |
| Immigrants | Western Asia | 93.1 /100 | #130 | Exceptional 8.7% |
| Slavs | 92.2 /100 | #131 | Exceptional 8.7% |
| Yaqui | 92.2 /100 | #132 | Exceptional 8.7% |
| Egyptians | 91.8 /100 | #133 | Exceptional 8.7% |
| Immigrants | Ireland | 91.0 /100 | #134 | Exceptional 8.7% |
| Europeans | 90.6 /100 | #135 | Exceptional 8.7% |
| Immigrants | Latvia | 90.4 /100 | #136 | Exceptional 8.7% |
| Immigrants | Argentina | 90.0 /100 | #137 | Excellent 8.7% |
| Immigrants | Ethiopia | 89.5 /100 | #138 | Excellent 8.8% |
| Northern Europeans | 89.2 /100 | #139 | Excellent 8.8% |
| Immigrants | Poland | 88.3 /100 | #140 | Excellent 8.8% |
| Serbians | 87.6 /100 | #141 | Excellent 8.8% |
| Immigrants | Austria | 87.5 /100 | #142 | Excellent 8.8% |
| Immigrants | Kenya | 86.1 /100 | #143 | Excellent 8.8% |
Demographics Similar to Tsimshian by Unemployment Among Women with Children Ages 6 to 17 years
In terms of unemployment among women with children ages 6 to 17 years, the demographic groups most similar to Tsimshian are Black/African American (11.4%, a difference of 0.11%), Native/Alaskan (11.5%, a difference of 0.63%), Chippewa (11.1%, a difference of 2.7%), Pennsylvania German (11.0%, a difference of 3.2%), and Ottawa (10.9%, a difference of 4.8%).
| Demographics | Rating | Rank | Unemployment Among Women with Children Ages 6 to 17 years |
| Cajuns | 0.0 /100 | #325 | Tragic 10.8% |
| Liberians | 0.0 /100 | #326 | Tragic 10.8% |
| Cape Verdeans | 0.0 /100 | #327 | Tragic 10.9% |
| Ottawa | 0.0 /100 | #328 | Tragic 10.9% |
| Pennsylvania Germans | 0.0 /100 | #329 | Tragic 11.0% |
| Chippewa | 0.0 /100 | #330 | Tragic 11.1% |
| Blacks/African Americans | 0.0 /100 | #331 | Tragic 11.4% |
| Tsimshian | 0.0 /100 | #332 | Tragic 11.4% |
| Natives/Alaskans | 0.0 /100 | #333 | Tragic 11.5% |
| Ugandans | 0.0 /100 | #334 | Tragic 12.0% |
| Colville | 0.0 /100 | #335 | Tragic 12.3% |
| Houma | 0.0 /100 | #336 | Tragic 12.5% |
| Immigrants | Yemen | 0.0 /100 | #337 | Tragic 12.7% |
| Hopi | 0.0 /100 | #338 | Tragic 12.9% |
| Sioux | 0.0 /100 | #339 | Tragic 13.2% |