Immigrants from Eritrea vs Immigrants from Vietnam 6th Grade
COMPARE
Immigrants from Eritrea
Immigrants from Vietnam
6th Grade
6th Grade Comparison
Immigrants from Eritrea
Immigrants from Vietnam
96.1%
6TH GRADE
0.0/ 100
METRIC RATING
289th/ 347
METRIC RANK
95.4%
6TH GRADE
0.0/ 100
METRIC RATING
314th/ 347
METRIC RANK
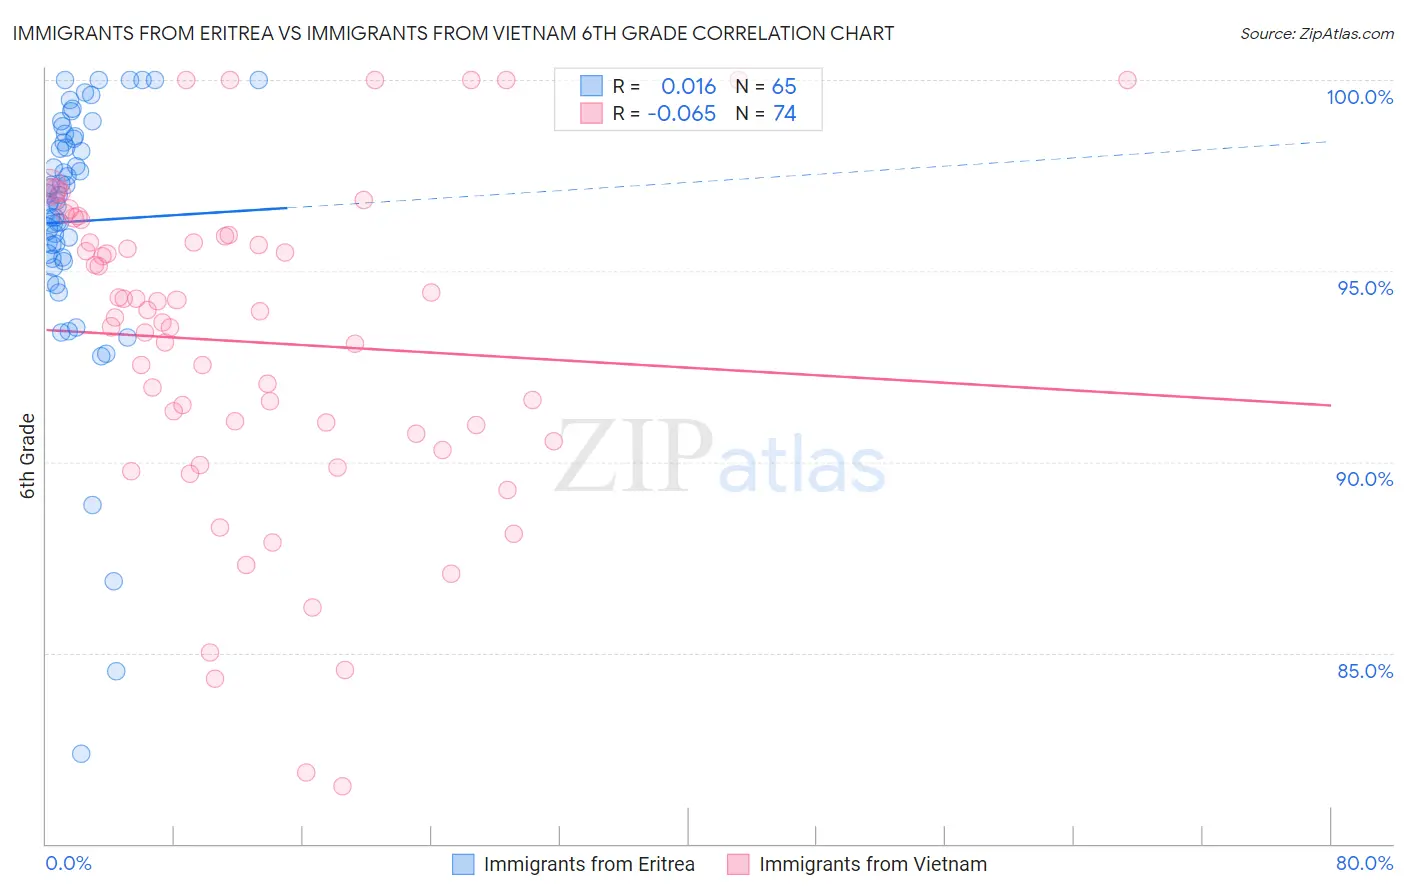
Immigrants from Eritrea vs Immigrants from Vietnam 6th Grade Correlation Chart
The statistical analysis conducted on geographies consisting of 104,764,182 people shows no correlation between the proportion of Immigrants from Eritrea and percentage of population with at least 6th grade education in the United States with a correlation coefficient (R) of 0.016 and weighted average of 96.1%. Similarly, the statistical analysis conducted on geographies consisting of 404,844,130 people shows a slight negative correlation between the proportion of Immigrants from Vietnam and percentage of population with at least 6th grade education in the United States with a correlation coefficient (R) of -0.065 and weighted average of 95.4%, a difference of 0.80%.
6th Grade Correlation Summary
| Measurement | Immigrants from Eritrea | Immigrants from Vietnam |
| Minimum | 82.4% | 81.5% |
| Maximum | 100.0% | 100.0% |
| Range | 17.6% | 18.5% |
| Mean | 96.3% | 93.1% |
| Median | 96.8% | 93.9% |
| Interquartile 25% (IQ1) | 95.3% | 90.7% |
| Interquartile 75% (IQ3) | 98.5% | 95.9% |
| Interquartile Range (IQR) | 3.2% | 5.2% |
| Standard Deviation (Sample) | 3.4% | 4.3% |
| Standard Deviation (Population) | 3.4% | 4.2% |
Similar Demographics by 6th Grade
Demographics Similar to Immigrants from Eritrea by 6th Grade
In terms of 6th grade, the demographic groups most similar to Immigrants from Eritrea are Malaysian (96.2%, a difference of 0.020%), Immigrants from Somalia (96.1%, a difference of 0.020%), Immigrants from St. Vincent and the Grenadines (96.1%, a difference of 0.020%), Immigrants from Trinidad and Tobago (96.2%, a difference of 0.030%), and Barbadian (96.2%, a difference of 0.040%).
| Demographics | Rating | Rank | 6th Grade |
| Houma | 0.1 /100 | #282 | Tragic 96.2% |
| Cubans | 0.1 /100 | #283 | Tragic 96.2% |
| Fijians | 0.1 /100 | #284 | Tragic 96.2% |
| Somalis | 0.1 /100 | #285 | Tragic 96.2% |
| Barbadians | 0.0 /100 | #286 | Tragic 96.2% |
| Immigrants | Trinidad and Tobago | 0.0 /100 | #287 | Tragic 96.2% |
| Malaysians | 0.0 /100 | #288 | Tragic 96.2% |
| Immigrants | Eritrea | 0.0 /100 | #289 | Tragic 96.1% |
| Immigrants | Somalia | 0.0 /100 | #290 | Tragic 96.1% |
| Immigrants | St. Vincent and the Grenadines | 0.0 /100 | #291 | Tragic 96.1% |
| Immigrants | Barbados | 0.0 /100 | #292 | Tragic 96.1% |
| Immigrants | West Indies | 0.0 /100 | #293 | Tragic 96.1% |
| British West Indians | 0.0 /100 | #294 | Tragic 96.0% |
| Immigrants | Grenada | 0.0 /100 | #295 | Tragic 95.9% |
| Immigrants | South Eastern Asia | 0.0 /100 | #296 | Tragic 95.9% |
Demographics Similar to Immigrants from Vietnam by 6th Grade
In terms of 6th grade, the demographic groups most similar to Immigrants from Vietnam are Nicaraguan (95.4%, a difference of 0.010%), Immigrants from Bangladesh (95.4%, a difference of 0.010%), Japanese (95.4%, a difference of 0.020%), Vietnamese (95.3%, a difference of 0.050%), and Belizean (95.3%, a difference of 0.070%).
| Demographics | Rating | Rank | 6th Grade |
| Guyanese | 0.0 /100 | #307 | Tragic 95.6% |
| Immigrants | Caribbean | 0.0 /100 | #308 | Tragic 95.6% |
| Puerto Ricans | 0.0 /100 | #309 | Tragic 95.5% |
| Ecuadorians | 0.0 /100 | #310 | Tragic 95.5% |
| Immigrants | Portugal | 0.0 /100 | #311 | Tragic 95.5% |
| Immigrants | Guyana | 0.0 /100 | #312 | Tragic 95.5% |
| Nicaraguans | 0.0 /100 | #313 | Tragic 95.4% |
| Immigrants | Vietnam | 0.0 /100 | #314 | Tragic 95.4% |
| Immigrants | Bangladesh | 0.0 /100 | #315 | Tragic 95.4% |
| Japanese | 0.0 /100 | #316 | Tragic 95.4% |
| Vietnamese | 0.0 /100 | #317 | Tragic 95.3% |
| Belizeans | 0.0 /100 | #318 | Tragic 95.3% |
| Immigrants | Belize | 0.0 /100 | #319 | Tragic 95.3% |
| Immigrants | Ecuador | 0.0 /100 | #320 | Tragic 95.3% |
| Immigrants | Fiji | 0.0 /100 | #321 | Tragic 95.2% |