Immigrants from Eritrea vs Immigrants from Vietnam 5th Grade
COMPARE
Immigrants from Eritrea
Immigrants from Vietnam
5th Grade
5th Grade Comparison
Immigrants from Eritrea
Immigrants from Vietnam
96.4%
5TH GRADE
0.0/ 100
METRIC RATING
294th/ 347
METRIC RANK
95.8%
5TH GRADE
0.0/ 100
METRIC RATING
318th/ 347
METRIC RANK
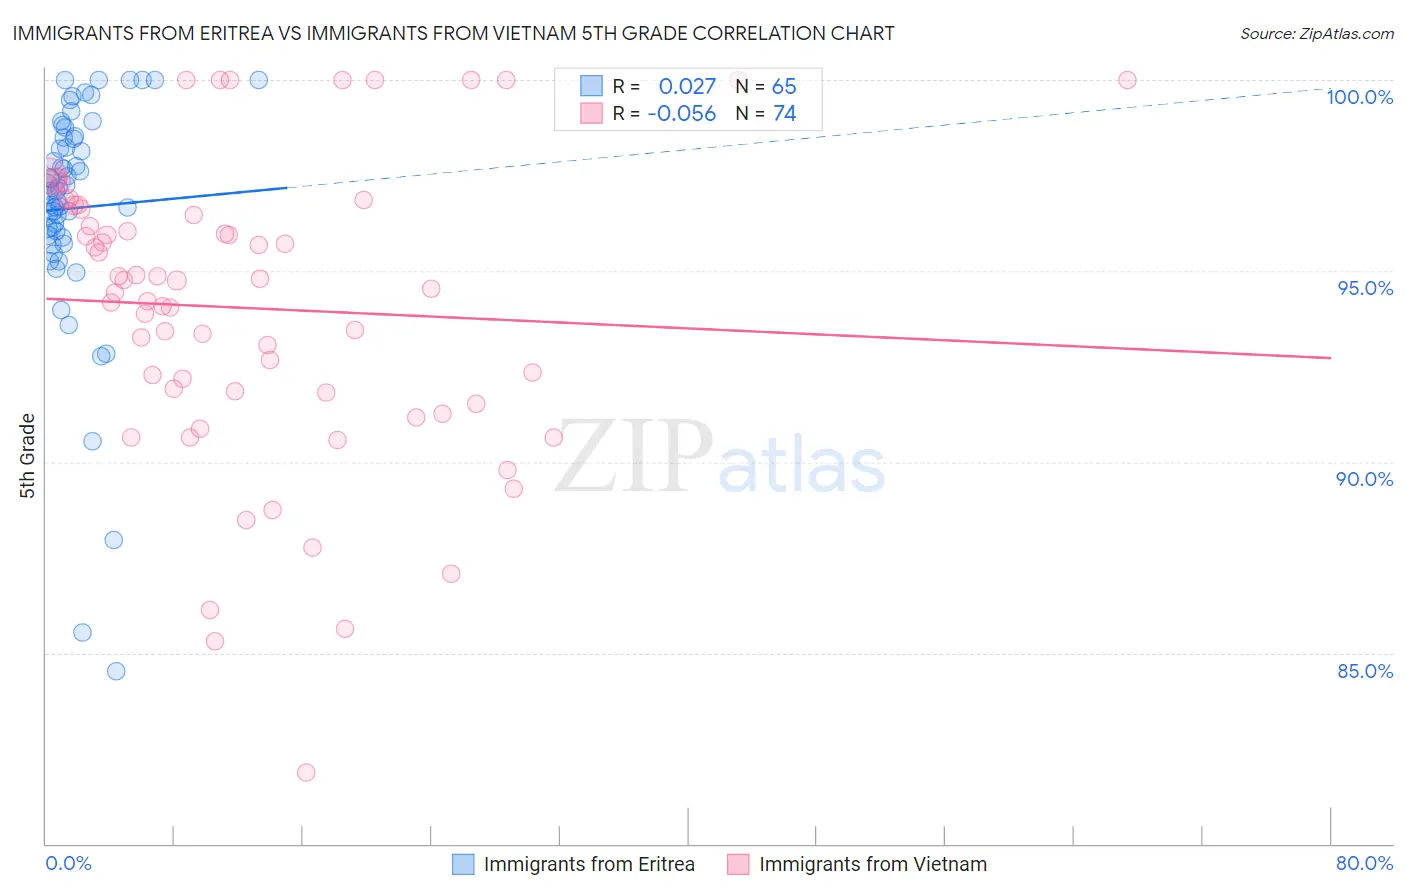
Immigrants from Eritrea vs Immigrants from Vietnam 5th Grade Correlation Chart
The statistical analysis conducted on geographies consisting of 104,792,854 people shows no correlation between the proportion of Immigrants from Eritrea and percentage of population with at least 5th grade education in the United States with a correlation coefficient (R) of 0.027 and weighted average of 96.4%. Similarly, the statistical analysis conducted on geographies consisting of 404,844,130 people shows a slight negative correlation between the proportion of Immigrants from Vietnam and percentage of population with at least 5th grade education in the United States with a correlation coefficient (R) of -0.056 and weighted average of 95.8%, a difference of 0.67%.
5th Grade Correlation Summary
| Measurement | Immigrants from Eritrea | Immigrants from Vietnam |
| Minimum | 84.5% | 81.9% |
| Maximum | 100.0% | 100.0% |
| Range | 15.5% | 18.1% |
| Mean | 96.6% | 94.0% |
| Median | 97.1% | 94.6% |
| Interquartile 25% (IQ1) | 95.9% | 91.8% |
| Interquartile 75% (IQ3) | 98.5% | 96.6% |
| Interquartile Range (IQR) | 2.6% | 4.8% |
| Standard Deviation (Sample) | 3.1% | 3.9% |
| Standard Deviation (Population) | 3.0% | 3.9% |
Similar Demographics by 5th Grade
Demographics Similar to Immigrants from Eritrea by 5th Grade
In terms of 5th grade, the demographic groups most similar to Immigrants from Eritrea are Immigrants from Grenada (96.5%, a difference of 0.040%), Immigrants from Somalia (96.4%, a difference of 0.040%), Somali (96.5%, a difference of 0.050%), British West Indian (96.5%, a difference of 0.060%), and Malaysian (96.5%, a difference of 0.060%).
| Demographics | Rating | Rank | 5th Grade |
| Immigrants | Afghanistan | 0.1 /100 | #287 | Tragic 96.6% |
| Immigrants | Barbados | 0.0 /100 | #288 | Tragic 96.6% |
| Immigrants | West Indies | 0.0 /100 | #289 | Tragic 96.5% |
| British West Indians | 0.0 /100 | #290 | Tragic 96.5% |
| Malaysians | 0.0 /100 | #291 | Tragic 96.5% |
| Somalis | 0.0 /100 | #292 | Tragic 96.5% |
| Immigrants | Grenada | 0.0 /100 | #293 | Tragic 96.5% |
| Immigrants | Eritrea | 0.0 /100 | #294 | Tragic 96.4% |
| Immigrants | Somalia | 0.0 /100 | #295 | Tragic 96.4% |
| Immigrants | South Eastern Asia | 0.0 /100 | #296 | Tragic 96.3% |
| Haitians | 0.0 /100 | #297 | Tragic 96.3% |
| Immigrants | Dominica | 0.0 /100 | #298 | Tragic 96.2% |
| Immigrants | Immigrants | 0.0 /100 | #299 | Tragic 96.2% |
| Sri Lankans | 0.0 /100 | #300 | Tragic 96.1% |
| Immigrants | Cuba | 0.0 /100 | #301 | Tragic 96.1% |
Demographics Similar to Immigrants from Vietnam by 5th Grade
In terms of 5th grade, the demographic groups most similar to Immigrants from Vietnam are Belizean (95.8%, a difference of 0.030%), Immigrants from Ecuador (95.8%, a difference of 0.050%), Japanese (95.7%, a difference of 0.050%), Central American Indian (95.7%, a difference of 0.050%), and Nicaraguan (95.9%, a difference of 0.12%).
| Demographics | Rating | Rank | 5th Grade |
| Immigrants | Bangladesh | 0.0 /100 | #311 | Tragic 96.0% |
| Vietnamese | 0.0 /100 | #312 | Tragic 95.9% |
| Bangladeshis | 0.0 /100 | #313 | Tragic 95.9% |
| Immigrants | Portugal | 0.0 /100 | #314 | Tragic 95.9% |
| Nicaraguans | 0.0 /100 | #315 | Tragic 95.9% |
| Immigrants | Ecuador | 0.0 /100 | #316 | Tragic 95.8% |
| Belizeans | 0.0 /100 | #317 | Tragic 95.8% |
| Immigrants | Vietnam | 0.0 /100 | #318 | Tragic 95.8% |
| Japanese | 0.0 /100 | #319 | Tragic 95.7% |
| Central American Indians | 0.0 /100 | #320 | Tragic 95.7% |
| Immigrants | Belize | 0.0 /100 | #321 | Tragic 95.7% |
| Immigrants | Nicaragua | 0.0 /100 | #322 | Tragic 95.6% |
| Immigrants | Fiji | 0.0 /100 | #323 | Tragic 95.6% |
| Hondurans | 0.0 /100 | #324 | Tragic 95.6% |
| Hispanics or Latinos | 0.0 /100 | #325 | Tragic 95.6% |