Immigrants from Western Asia vs Hungarian Married-couple Households
COMPARE
Immigrants from Western Asia
Hungarian
Married-couple Households
Married-couple Households Comparison
Immigrants from Western Asia
Hungarians
46.9%
MARRIED-COUPLE HOUSEHOLDS
76.1/ 100
METRIC RATING
154th/ 347
METRIC RANK
49.1%
MARRIED-COUPLE HOUSEHOLDS
99.8/ 100
METRIC RATING
32nd/ 347
METRIC RANK
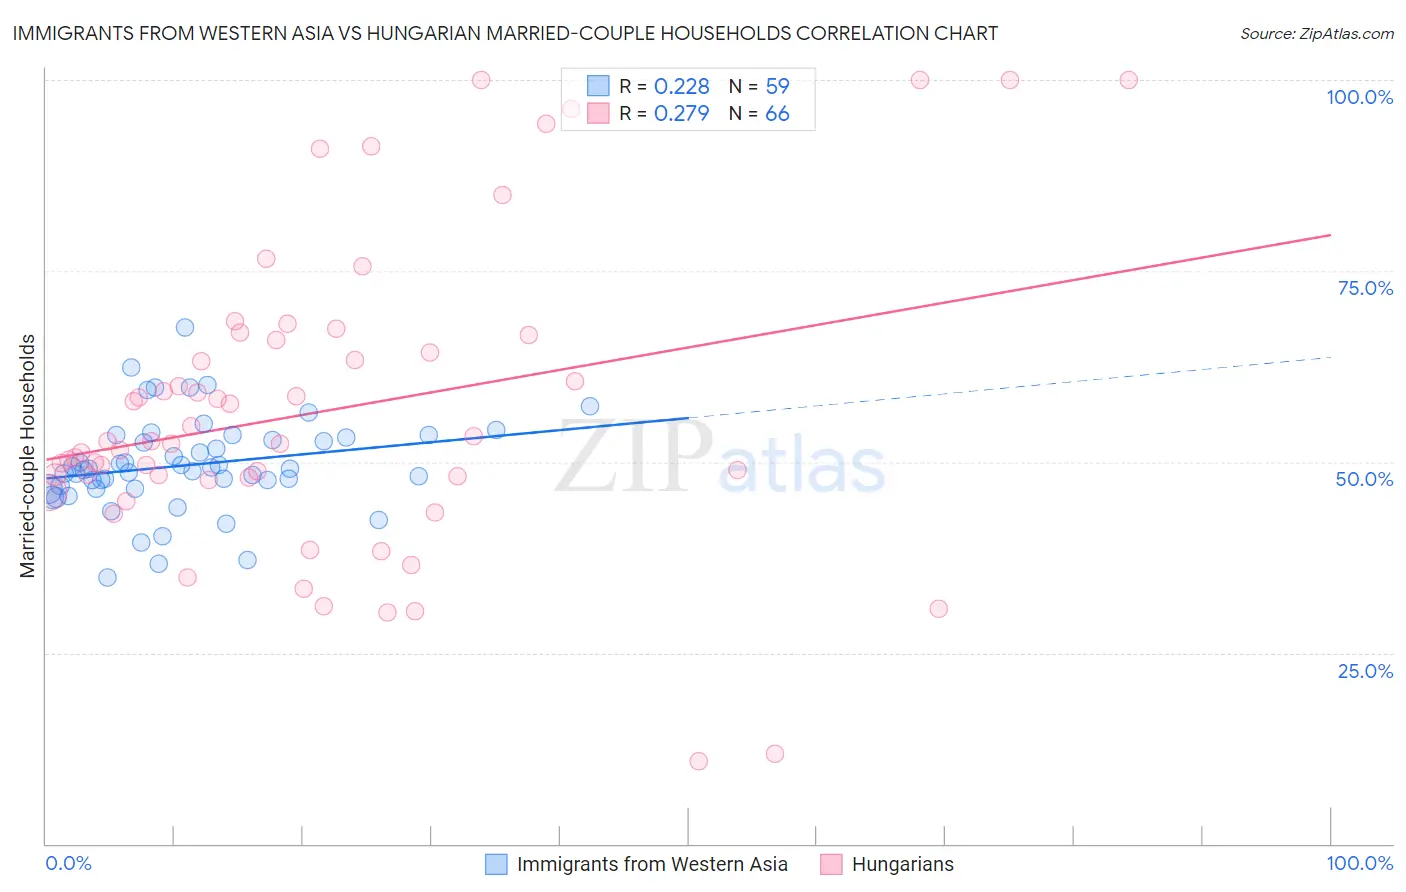
Immigrants from Western Asia vs Hungarian Married-couple Households Correlation Chart
The statistical analysis conducted on geographies consisting of 404,157,089 people shows a weak positive correlation between the proportion of Immigrants from Western Asia and percentage of married-couple family households in the United States with a correlation coefficient (R) of 0.228 and weighted average of 46.9%. Similarly, the statistical analysis conducted on geographies consisting of 485,875,006 people shows a weak positive correlation between the proportion of Hungarians and percentage of married-couple family households in the United States with a correlation coefficient (R) of 0.279 and weighted average of 49.1%, a difference of 4.5%.
Married-couple Households Correlation Summary
| Measurement | Immigrants from Western Asia | Hungarian |
| Minimum | 34.9% | 10.9% |
| Maximum | 67.5% | 100.0% |
| Range | 32.6% | 89.1% |
| Mean | 49.6% | 56.7% |
| Median | 49.1% | 52.5% |
| Interquartile 25% (IQ1) | 46.6% | 47.9% |
| Interquartile 75% (IQ3) | 53.1% | 65.9% |
| Interquartile Range (IQR) | 6.6% | 18.0% |
| Standard Deviation (Sample) | 6.2% | 19.9% |
| Standard Deviation (Population) | 6.1% | 19.8% |
Similar Demographics by Married-couple Households
Demographics Similar to Immigrants from Western Asia by Married-couple Households
In terms of married-couple households, the demographic groups most similar to Immigrants from Western Asia are Hmong (47.0%, a difference of 0.0%), Serbian (47.0%, a difference of 0.010%), Arab (46.9%, a difference of 0.010%), Immigrants from Bulgaria (47.0%, a difference of 0.040%), and Armenian (46.9%, a difference of 0.040%).
| Demographics | Rating | Rank | Married-couple Households |
| Immigrants | Syria | 81.6 /100 | #147 | Excellent 47.1% |
| Icelanders | 79.5 /100 | #148 | Good 47.0% |
| Paraguayans | 78.7 /100 | #149 | Good 47.0% |
| Immigrants | Russia | 77.6 /100 | #150 | Good 47.0% |
| Immigrants | Bulgaria | 76.8 /100 | #151 | Good 47.0% |
| Serbians | 76.3 /100 | #152 | Good 47.0% |
| Hmong | 76.2 /100 | #153 | Good 47.0% |
| Immigrants | Western Asia | 76.1 /100 | #154 | Good 46.9% |
| Arabs | 76.0 /100 | #155 | Good 46.9% |
| Armenians | 75.4 /100 | #156 | Good 46.9% |
| Immigrants | Oceania | 74.8 /100 | #157 | Good 46.9% |
| Immigrants | Nonimmigrants | 73.3 /100 | #158 | Good 46.9% |
| Osage | 73.2 /100 | #159 | Good 46.9% |
| Iraqis | 71.7 /100 | #160 | Good 46.9% |
| Delaware | 71.2 /100 | #161 | Good 46.8% |
Demographics Similar to Hungarians by Married-couple Households
In terms of married-couple households, the demographic groups most similar to Hungarians are Immigrants from Asia (49.1%, a difference of 0.030%), Native Hawaiian (49.1%, a difference of 0.060%), Italian (49.0%, a difference of 0.11%), Scottish (49.0%, a difference of 0.13%), and Bolivian (49.2%, a difference of 0.17%).
| Demographics | Rating | Rank | Married-couple Households |
| Immigrants | Philippines | 99.9 /100 | #25 | Exceptional 49.3% |
| Immigrants | Scotland | 99.8 /100 | #26 | Exceptional 49.3% |
| Bhutanese | 99.8 /100 | #27 | Exceptional 49.3% |
| Germans | 99.8 /100 | #28 | Exceptional 49.2% |
| Maltese | 99.8 /100 | #29 | Exceptional 49.2% |
| Bolivians | 99.8 /100 | #30 | Exceptional 49.2% |
| Native Hawaiians | 99.8 /100 | #31 | Exceptional 49.1% |
| Hungarians | 99.8 /100 | #32 | Exceptional 49.1% |
| Immigrants | Asia | 99.7 /100 | #33 | Exceptional 49.1% |
| Italians | 99.7 /100 | #34 | Exceptional 49.0% |
| Scottish | 99.7 /100 | #35 | Exceptional 49.0% |
| Iranians | 99.7 /100 | #36 | Exceptional 49.0% |
| Sri Lankans | 99.7 /100 | #37 | Exceptional 49.0% |
| Greeks | 99.7 /100 | #38 | Exceptional 48.9% |
| Lithuanians | 99.6 /100 | #39 | Exceptional 48.9% |