Immigrants from Denmark vs Immigrants from Trinidad and Tobago Married-couple Households
COMPARE
Immigrants from Denmark
Immigrants from Trinidad and Tobago
Married-couple Households
Married-couple Households Comparison
Immigrants from Denmark
Immigrants from Trinidad and Tobago
47.3%
MARRIED-COUPLE HOUSEHOLDS
87.5/ 100
METRIC RATING
131st/ 347
METRIC RANK
41.2%
MARRIED-COUPLE HOUSEHOLDS
0.0/ 100
METRIC RATING
309th/ 347
METRIC RANK
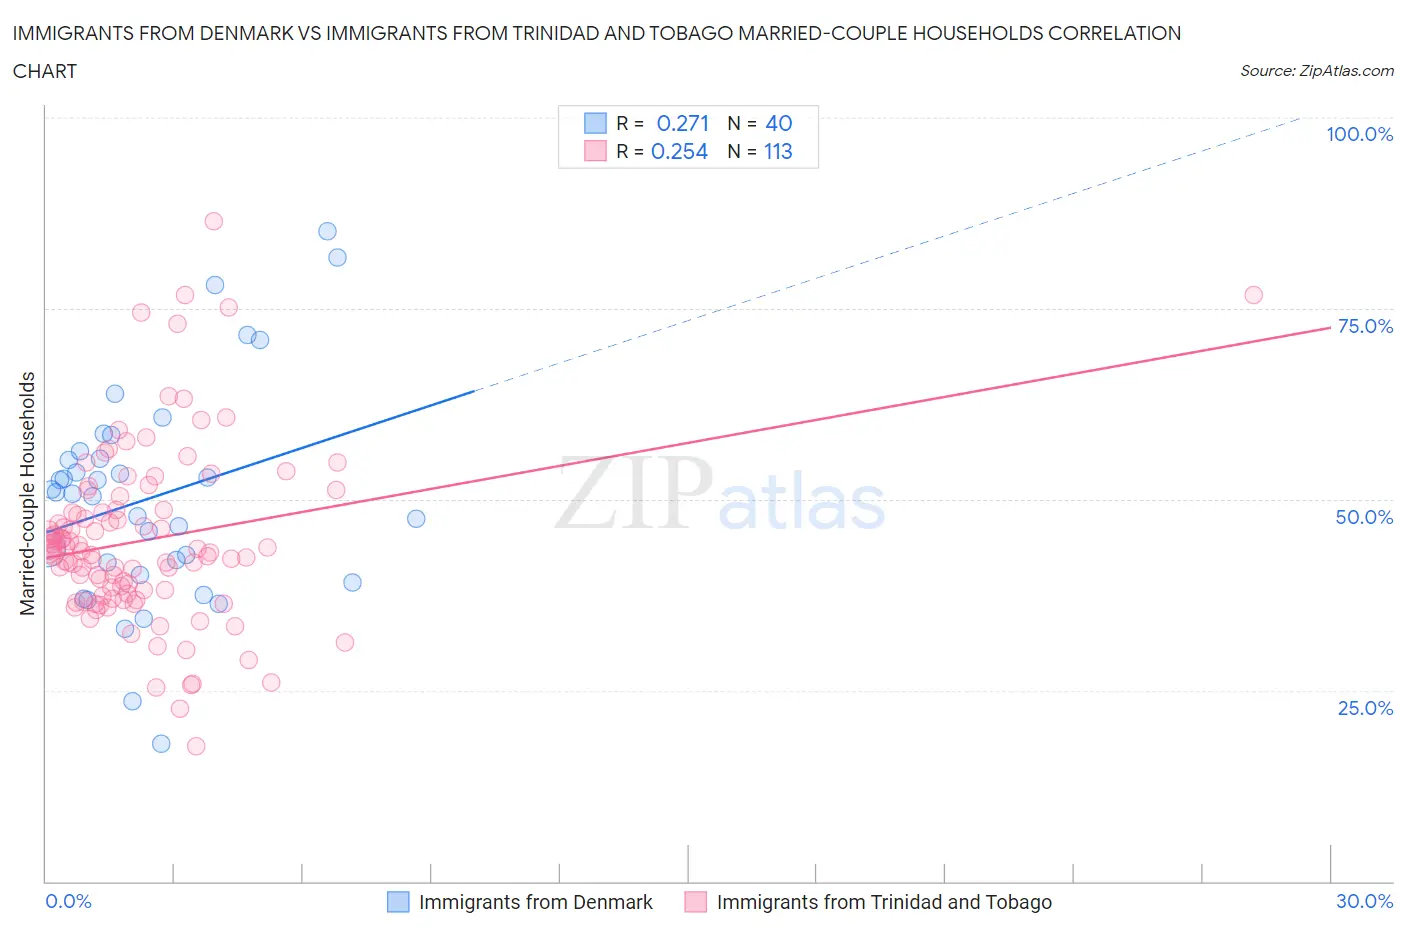
Immigrants from Denmark vs Immigrants from Trinidad and Tobago Married-couple Households Correlation Chart
The statistical analysis conducted on geographies consisting of 136,404,996 people shows a weak positive correlation between the proportion of Immigrants from Denmark and percentage of married-couple family households in the United States with a correlation coefficient (R) of 0.271 and weighted average of 47.3%. Similarly, the statistical analysis conducted on geographies consisting of 223,481,382 people shows a weak positive correlation between the proportion of Immigrants from Trinidad and Tobago and percentage of married-couple family households in the United States with a correlation coefficient (R) of 0.254 and weighted average of 41.2%, a difference of 14.8%.
Married-couple Households Correlation Summary
| Measurement | Immigrants from Denmark | Immigrants from Trinidad and Tobago |
| Minimum | 18.0% | 17.7% |
| Maximum | 85.1% | 86.4% |
| Range | 67.1% | 68.7% |
| Mean | 50.2% | 44.7% |
| Median | 50.8% | 43.2% |
| Interquartile 25% (IQ1) | 40.9% | 37.5% |
| Interquartile 75% (IQ3) | 55.8% | 48.6% |
| Interquartile Range (IQR) | 14.9% | 11.2% |
| Standard Deviation (Sample) | 14.3% | 11.5% |
| Standard Deviation (Population) | 14.1% | 11.5% |
Similar Demographics by Married-couple Households
Demographics Similar to Immigrants from Denmark by Married-couple Households
In terms of married-couple households, the demographic groups most similar to Immigrants from Denmark are Immigrants from Iraq (47.3%, a difference of 0.020%), Immigrants from Hungary (47.3%, a difference of 0.020%), Immigrants from Peru (47.3%, a difference of 0.030%), Celtic (47.3%, a difference of 0.050%), and Immigrants from Ukraine (47.3%, a difference of 0.070%).
| Demographics | Rating | Rank | Married-couple Households |
| Zimbabweans | 89.2 /100 | #124 | Excellent 47.4% |
| Australians | 89.0 /100 | #125 | Excellent 47.4% |
| Pakistanis | 88.6 /100 | #126 | Excellent 47.3% |
| Celtics | 88.1 /100 | #127 | Excellent 47.3% |
| Immigrants | Peru | 87.9 /100 | #128 | Excellent 47.3% |
| Immigrants | Iraq | 87.8 /100 | #129 | Excellent 47.3% |
| Immigrants | Hungary | 87.8 /100 | #130 | Excellent 47.3% |
| Immigrants | Denmark | 87.5 /100 | #131 | Excellent 47.3% |
| Immigrants | Ukraine | 86.7 /100 | #132 | Excellent 47.3% |
| South Africans | 86.4 /100 | #133 | Excellent 47.3% |
| Immigrants | Greece | 86.0 /100 | #134 | Excellent 47.2% |
| Immigrants | Argentina | 86.0 /100 | #135 | Excellent 47.2% |
| New Zealanders | 85.3 /100 | #136 | Excellent 47.2% |
| Immigrants | Malaysia | 85.2 /100 | #137 | Excellent 47.2% |
| Immigrants | Afghanistan | 85.1 /100 | #138 | Excellent 47.2% |
Demographics Similar to Immigrants from Trinidad and Tobago by Married-couple Households
In terms of married-couple households, the demographic groups most similar to Immigrants from Trinidad and Tobago are Haitian (41.2%, a difference of 0.070%), Crow (41.4%, a difference of 0.35%), Guyanese (41.4%, a difference of 0.36%), Immigrants from Western Africa (41.4%, a difference of 0.36%), and Colville (41.0%, a difference of 0.57%).
| Demographics | Rating | Rank | Married-couple Households |
| Immigrants | Honduras | 0.0 /100 | #302 | Tragic 41.6% |
| Sub-Saharan Africans | 0.0 /100 | #303 | Tragic 41.6% |
| Immigrants | Guyana | 0.0 /100 | #304 | Tragic 41.6% |
| Sioux | 0.0 /100 | #305 | Tragic 41.5% |
| Guyanese | 0.0 /100 | #306 | Tragic 41.4% |
| Immigrants | Western Africa | 0.0 /100 | #307 | Tragic 41.4% |
| Crow | 0.0 /100 | #308 | Tragic 41.4% |
| Immigrants | Trinidad and Tobago | 0.0 /100 | #309 | Tragic 41.2% |
| Haitians | 0.0 /100 | #310 | Tragic 41.2% |
| Colville | 0.0 /100 | #311 | Tragic 41.0% |
| Africans | 0.0 /100 | #312 | Tragic 40.9% |
| Immigrants | Haiti | 0.0 /100 | #313 | Tragic 40.9% |
| Jamaicans | 0.0 /100 | #314 | Tragic 40.9% |
| Trinidadians and Tobagonians | 0.0 /100 | #315 | Tragic 40.9% |
| Immigrants | Caribbean | 0.0 /100 | #316 | Tragic 40.8% |