Immigrants from Denmark vs Bangladeshi Married-couple Households

COMPARE

Immigrants from Denmark
Race
Ancestry
AfghanAfricanAlaska NativeAlaskan AthabascanAlbanianAleutAlsatianAmericanApacheArabArapahoArgentineanArmenianAssyrian/Chaldean/SyriacAustralianAustrianBahamianBarbadianBasqueBelgianBelizeanBermudanBhutaneseBlackfeetBolivianBrazilianBritishBritish West IndianBulgarianBurmeseCajunCambodianCanadianCape VerdeanCarpatho RusynCelticCentral AmericanCentral American IndianCherokeeCheyenneChickasawChileanChineseChippewaChoctawColombianColvilleComancheCosta RicanCreeCreekCroatianCrowCubanCypriotCzechCzechoslovakianDanishDelawareDominicanDutchDutch West IndianEastern EuropeanEcuadorianEgyptianEnglishEstonianEthiopianEuropeanFijianFilipinoFinnishFrenchFrench American IndianFrench CanadianGermanGerman RussianGhanaianGreekGuamanian/ChamorroGuatemalanGuyaneseHaitianHmongHonduranHopiHoumaHungarianIcelanderIndian (Asian)IndonesianInupiatIranianIraqiIrishIroquoisIsraeliItalianJamaicanJapaneseJordanianKenyanKiowaKoreanLaotianLatvianLebaneseLiberianLithuanianLumbeeLuxembourgerMacedonianMalaysianMalteseMarshalleseMenomineeMexicanMexican American IndianMongolianMoroccanNative HawaiianNavajoNepaleseNew ZealanderNicaraguanNigerianNorthern EuropeanNorwegianOkinawanOsageOttawaPaiutePakistaniPalestinianPanamanianParaguayanPennsylvania GermanPeruvianPimaPolishPortuguesePotawatomiPuebloPuerto RicanPuget Sound SalishRomanianRussianSalvadoranSamoanScandinavianScotch-IrishScottishSeminoleSenegaleseSerbianShoshoneSierra LeoneanSiouxSlavicSlovakSloveneSomaliSouth AfricanSouth AmericanSouth American IndianSoviet UnionSpaniardSpanishSpanish AmericanSpanish American IndianSri LankanSubsaharan AfricanSudaneseSwedishSwissSyrianTaiwaneseThaiTlingit-HaidaTohono O'OdhamTonganTrinidadian and TobagonianTsimshianTurkishU.S. Virgin IslanderUgandanUkrainianUruguayanUteVenezuelanVietnameseWelshWest IndianYakamaYaquiYugoslavianYumanYup'ikZimbabwean
Immigration
NonimmigrantsImmigrantsAfghanistanAfricaAlbaniaArgentinaArmeniaAsiaAustraliaAustriaBahamasBangladeshBarbadosBelarusBelgiumBelizeBoliviaBosnia and HerzegovinaBrazilBulgariaBurma/MyanmarCabo VerdeCambodiaCameroonCanadaCaribbeanCentral AmericaChileChinaColombiaCongoCosta RicaCroatiaCubaCzechoslovakiaDenmarkDominicaDominican RepublicEastern AfricaEastern AsiaEastern EuropeEcuadorEgyptEl SalvadorEnglandEritreaEthiopiaEuropeFijiFranceGermanyGhanaGreeceGrenadaGuatemalaGuyanaHaitiHondurasHong KongHungaryIndiaIndonesiaIranIraqIrelandIsraelItalyJamaicaJapanJordanKazakhstanKenyaKoreaKuwaitLaosLatin AmericaLatviaLebanonLiberiaLithuaniaMalaysiaMexicoMicronesiaMiddle AfricaMoldovaMoroccoNepalNetherlandsNicaraguaNigeriaNorth AmericaNorth MacedoniaNorthern AfricaNorthern EuropeNorwayOceaniaPakistanPanamaPeruPhilippinesPolandPortugalRomaniaRussiaSaudi ArabiaScotlandSenegalSerbiaSierra LeoneSingaporeSomaliaSouth AfricaSouth AmericaSouth Central AsiaSouth Eastern AsiaSouthern EuropeSpainSri LankaSt. Vincent and the GrenadinesSudanSwedenSwitzerlandSyriaTaiwanThailandTrinidad and TobagoTurkeyUgandaUkraineUruguayUzbekistanVenezuelaVietnamWest IndiesWestern AfricaWestern AsiaWestern EuropeYemenZaireZimbabweAzores
Bangladeshi
Race
Ancestry
AfghanAfricanAlaska NativeAlaskan AthabascanAlbanianAleutAlsatianAmericanApacheArabArapahoArgentineanArmenianAssyrian/Chaldean/SyriacAustralianAustrianBahamianBangladeshiBarbadianBasqueBelgianBelizeanBermudanBhutaneseBlackfeetBolivianBrazilianBritishBritish West IndianBulgarianBurmeseCajunCambodianCanadianCape VerdeanCarpatho RusynCelticCentral AmericanCentral American IndianCherokeeCheyenneChickasawChileanChineseChippewaChoctawColombianColvilleComancheCosta RicanCreeCreekCroatianCrowCubanCypriotCzechCzechoslovakianDanishDelawareDominicanDutchDutch West IndianEastern EuropeanEcuadorianEgyptianEnglishEstonianEthiopianEuropeanFijianFilipinoFinnishFrenchFrench American IndianFrench CanadianGermanGerman RussianGhanaianGreekGuamanian/ChamorroGuatemalanGuyaneseHaitianHmongHonduranHopiHoumaHungarianIcelanderIndian (Asian)IndonesianInupiatIranianIraqiIrishIroquoisIsraeliItalianJamaicanJapaneseJordanianKenyanKiowaKoreanLaotianLatvianLebaneseLiberianLithuanianLumbeeLuxembourgerMacedonianMalaysianMalteseMarshalleseMenomineeMexicanMexican American IndianMongolianMoroccanNative HawaiianNavajoNepaleseNew ZealanderNicaraguanNigerianNorthern EuropeanNorwegianOkinawanOsageOttawaPaiutePakistaniPalestinianPanamanianParaguayanPennsylvania GermanPeruvianPimaPolishPortuguesePotawatomiPuebloPuerto RicanPuget Sound SalishRomanianRussianSalvadoranSamoanScandinavianScotch-IrishScottishSeminoleSenegaleseSerbianShoshoneSierra LeoneanSiouxSlavicSlovakSloveneSomaliSouth AfricanSouth AmericanSouth American IndianSoviet UnionSpaniardSpanishSpanish AmericanSpanish American IndianSri LankanSubsaharan AfricanSudaneseSwedishSwissSyrianTaiwaneseThaiTlingit-HaidaTohono O'OdhamTonganTrinidadian and TobagonianTsimshianTurkishU.S. Virgin IslanderUgandanUkrainianUruguayanUteVenezuelanVietnameseWelshWest IndianYakamaYaquiYugoslavianYumanYup'ikZimbabwean
Immigration
NonimmigrantsImmigrantsAfghanistanAfricaAlbaniaArgentinaArmeniaAsiaAustraliaAustriaBahamasBangladeshBarbadosBelarusBelgiumBelizeBoliviaBosnia and HerzegovinaBrazilBulgariaBurma/MyanmarCabo VerdeCambodiaCameroonCanadaCaribbeanCentral AmericaChileChinaColombiaCongoCosta RicaCroatiaCubaCzechoslovakiaDominicaDominican RepublicEastern AfricaEastern AsiaEastern EuropeEcuadorEgyptEl SalvadorEnglandEritreaEthiopiaEuropeFijiFranceGermanyGhanaGreeceGrenadaGuatemalaGuyanaHaitiHondurasHong KongHungaryIndiaIndonesiaIranIraqIrelandIsraelItalyJamaicaJapanJordanKazakhstanKenyaKoreaKuwaitLaosLatin AmericaLatviaLebanonLiberiaLithuaniaMalaysiaMexicoMicronesiaMiddle AfricaMoldovaMoroccoNepalNetherlandsNicaraguaNigeriaNorth AmericaNorth MacedoniaNorthern AfricaNorthern EuropeNorwayOceaniaPakistanPanamaPeruPhilippinesPolandPortugalRomaniaRussiaSaudi ArabiaScotlandSenegalSerbiaSierra LeoneSingaporeSomaliaSouth AfricaSouth AmericaSouth Central AsiaSouth Eastern AsiaSouthern EuropeSpainSri LankaSt. Vincent and the GrenadinesSudanSwedenSwitzerlandSyriaTaiwanThailandTrinidad and TobagoTurkeyUgandaUkraineUruguayUzbekistanVenezuelaVietnamWest IndiesWestern AfricaWestern AsiaWestern EuropeYemenZaireZimbabweAzores
Married-couple Households
Income
Poverty
Unemployment
Labor Participation
Family Structure
Vehicle Availability
Education Level
Disability

Married-couple Households Comparison

Immigrants from Denmark

Bangladeshis

Excellent
Tragic
47.3%
MARRIED-COUPLE HOUSEHOLDS
87.5/ 100
METRIC RATING
131st/ 347
METRIC RANK
43.5%
MARRIED-COUPLE HOUSEHOLDS
0.1/ 100
METRIC RATING
264th/ 347
METRIC RANK

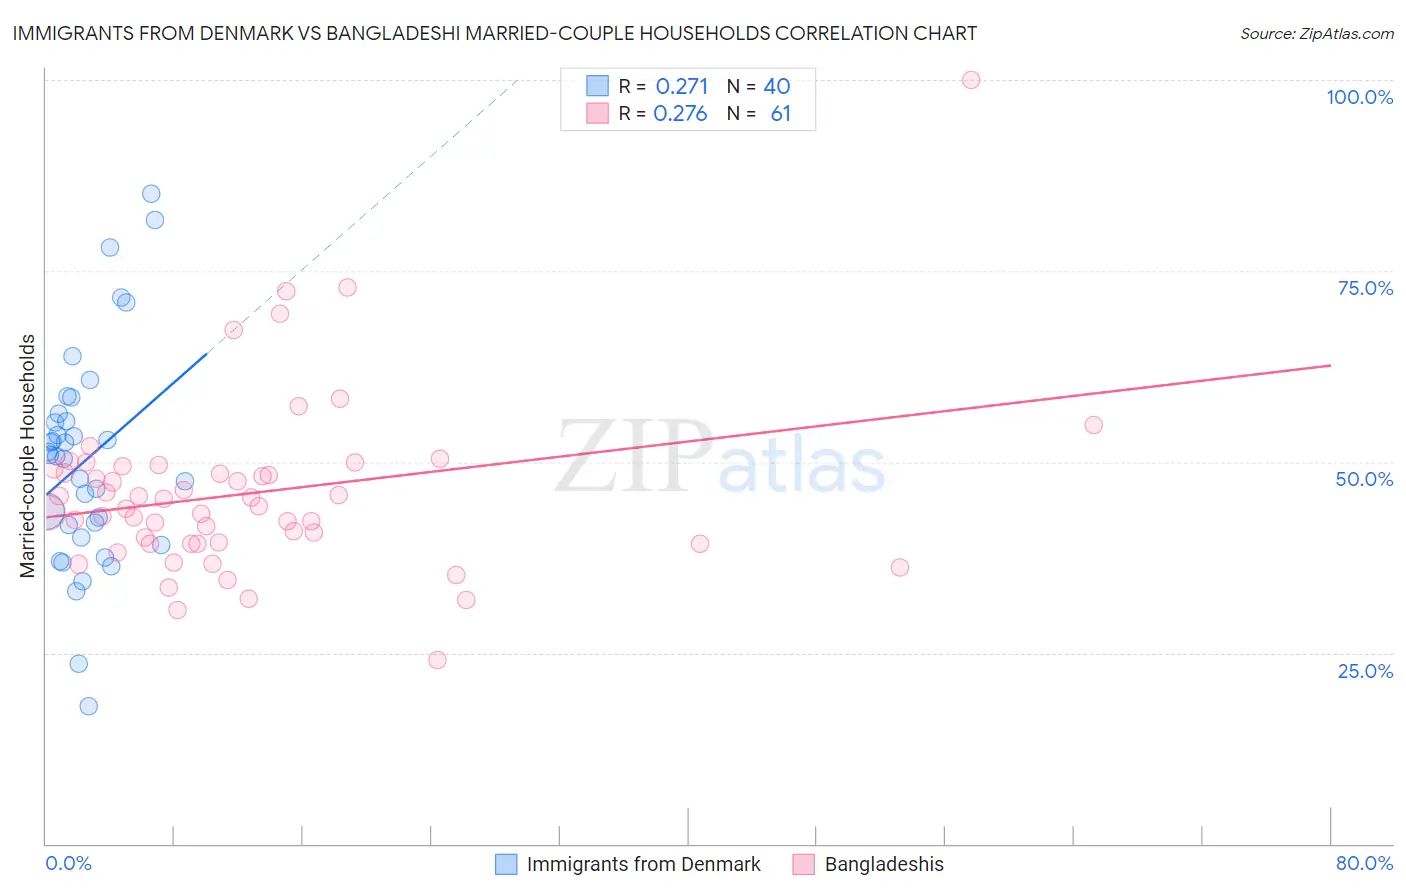
Immigrants from Denmark vs Bangladeshi Married-couple Households Correlation Chart

The statistical analysis conducted on geographies consisting of 136,404,996 people shows a weak positive correlation between the proportion of Immigrants from Denmark and percentage of married-couple family households in the United States with a correlation coefficient (R) of 0.271 and weighted average of 47.3%. Similarly, the statistical analysis conducted on geographies consisting of 141,328,159 people shows a weak positive correlation between the proportion of Bangladeshis and percentage of married-couple family households in the United States with a correlation coefficient (R) of 0.276 and weighted average of 43.5%, a difference of 8.7%.
Immigrants from Denmark vs Bangladeshi Married-couple Households

Married-couple Households Correlation Summary

MeasurementImmigrants from DenmarkBangladeshi
Minimum18.0%24.1%
Maximum85.1%100.0%
Range67.1%75.9%
Mean50.2%46.0%
Median50.8%44.1%
Interquartile 25% (IQ1)40.9%39.3%
Interquartile 75% (IQ3)55.8%49.3%
Interquartile Range (IQR)14.9%9.9%
Standard Deviation (Sample)14.3%11.7%
Standard Deviation (Population)14.1%11.6%

Similar Demographics by Married-couple Households

Demographics Similar to Immigrants from Denmark by Married-couple Households

In terms of married-couple households, the demographic groups most similar to Immigrants from Denmark are Immigrants from Iraq (47.3%, a difference of 0.020%), Immigrants from Hungary (47.3%, a difference of 0.020%), Immigrants from Peru (47.3%, a difference of 0.030%), Celtic (47.3%, a difference of 0.050%), and Immigrants from Ukraine (47.3%, a difference of 0.070%).
DemographicsRating | RankMarried-couple Households
Zimbabweans
89.2
/100
|
#124
Excellent
47.4%
Australians
89.0
/100
|
#125
Excellent
47.4%
Pakistanis
88.6
/100
|
#126
Excellent
47.3%
Celtics
88.1
/100
|
#127
Excellent
47.3%
Immigrants | Peru
87.9
/100
|
#128
Excellent
47.3%
Immigrants | Iraq
87.8
/100
|
#129
Excellent
47.3%
Immigrants | Hungary
87.8
/100
|
#130
Excellent
47.3%
Immigrants | Denmark
87.5
/100
|
#131
Excellent
47.3%
Immigrants | Ukraine
86.7
/100
|
#132
Excellent
47.3%
South Africans
86.4
/100
|
#133
Excellent
47.3%
Immigrants | Greece
86.0
/100
|
#134
Excellent
47.2%
Immigrants | Argentina
86.0
/100
|
#135
Excellent
47.2%
New Zealanders
85.3
/100
|
#136
Excellent
47.2%
Immigrants | Malaysia
85.2
/100
|
#137
Excellent
47.2%
Immigrants | Afghanistan
85.1
/100
|
#138
Excellent
47.2%

Demographics Similar to Bangladeshis by Married-couple Households

In terms of married-couple households, the demographic groups most similar to Bangladeshis are Moroccan (43.5%, a difference of 0.080%), Cree (43.6%, a difference of 0.11%), Ecuadorian (43.5%, a difference of 0.12%), Native/Alaskan (43.5%, a difference of 0.17%), and Vietnamese (43.6%, a difference of 0.22%).
DemographicsRating | RankMarried-couple Households
Blackfeet
0.2
/100
|
#257
Tragic
43.8%
Central American Indians
0.2
/100
|
#258
Tragic
43.8%
Iroquois
0.2
/100
|
#259
Tragic
43.7%
Immigrants | Cameroon
0.2
/100
|
#260
Tragic
43.7%
Alaskan Athabascans
0.2
/100
|
#261
Tragic
43.6%
Vietnamese
0.2
/100
|
#262
Tragic
43.6%
Cree
0.1
/100
|
#263
Tragic
43.6%
Bangladeshis
0.1
/100
|
#264
Tragic
43.5%
Moroccans
0.1
/100
|
#265
Tragic
43.5%
Ecuadorians
0.1
/100
|
#266
Tragic
43.5%
Natives/Alaskans
0.1
/100
|
#267
Tragic
43.5%
Immigrants | Burma/Myanmar
0.1
/100
|
#268
Tragic
43.4%
Immigrants | Sierra Leone
0.1
/100
|
#269
Tragic
43.3%
Yuman
0.1
/100
|
#270
Tragic
43.3%
Guatemalans
0.1
/100
|
#271
Tragic
43.3%