Immigrants from Denmark vs Tlingit-Haida Married-couple Households
COMPARE
Immigrants from Denmark
Tlingit-Haida
Married-couple Households
Married-couple Households Comparison
Immigrants from Denmark
Tlingit-Haida
47.3%
MARRIED-COUPLE HOUSEHOLDS
87.5/ 100
METRIC RATING
131st/ 347
METRIC RANK
45.1%
MARRIED-COUPLE HOUSEHOLDS
4.9/ 100
METRIC RATING
221st/ 347
METRIC RANK
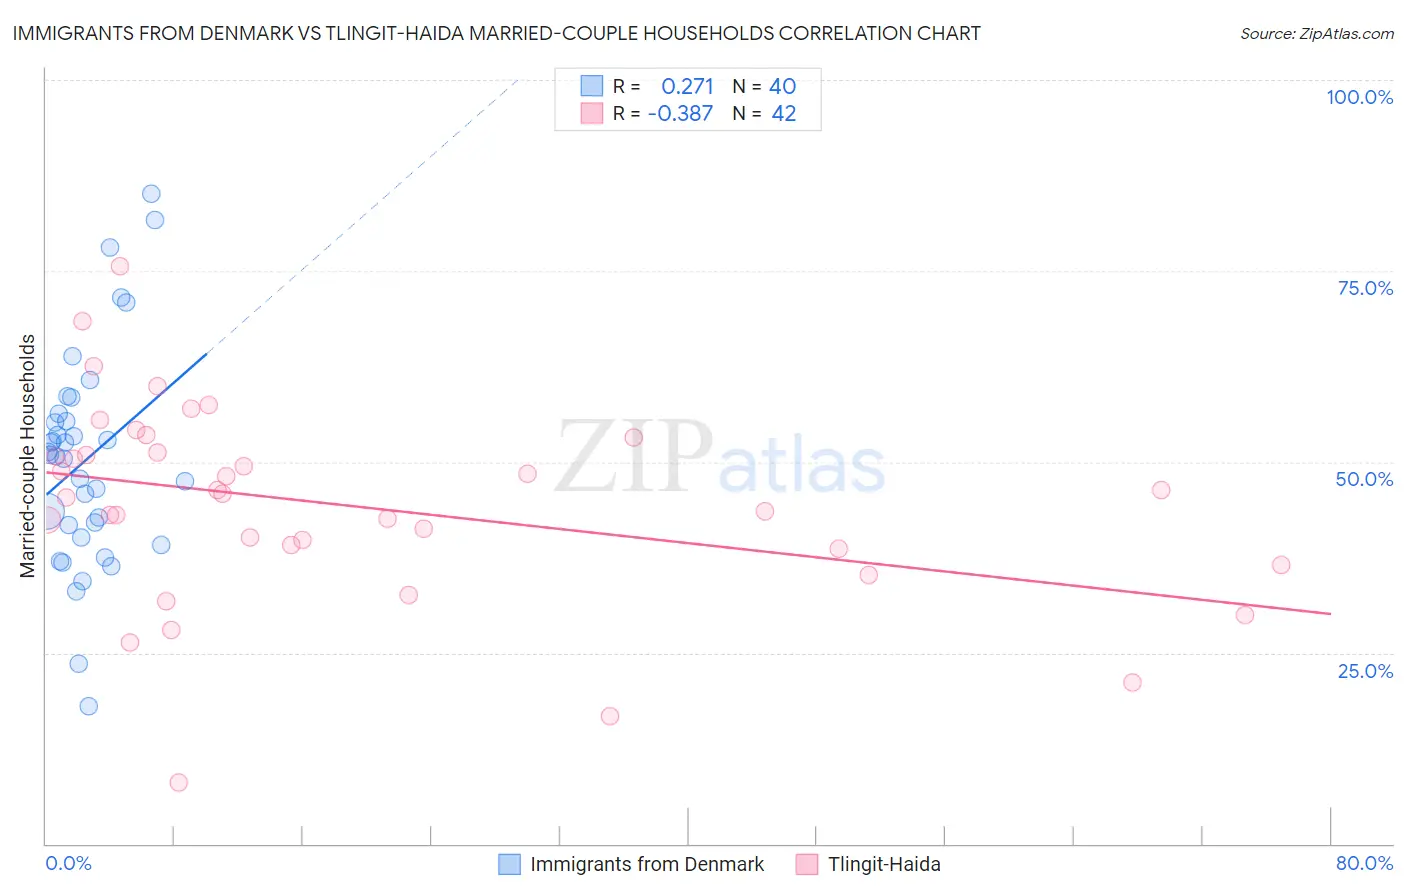
Immigrants from Denmark vs Tlingit-Haida Married-couple Households Correlation Chart
The statistical analysis conducted on geographies consisting of 136,404,996 people shows a weak positive correlation between the proportion of Immigrants from Denmark and percentage of married-couple family households in the United States with a correlation coefficient (R) of 0.271 and weighted average of 47.3%. Similarly, the statistical analysis conducted on geographies consisting of 60,855,605 people shows a mild negative correlation between the proportion of Tlingit-Haida and percentage of married-couple family households in the United States with a correlation coefficient (R) of -0.387 and weighted average of 45.1%, a difference of 4.8%.
Married-couple Households Correlation Summary
| Measurement | Immigrants from Denmark | Tlingit-Haida |
| Minimum | 18.0% | 8.0% |
| Maximum | 85.1% | 75.5% |
| Range | 67.1% | 67.5% |
| Mean | 50.2% | 44.2% |
| Median | 50.8% | 45.5% |
| Interquartile 25% (IQ1) | 40.9% | 38.7% |
| Interquartile 75% (IQ3) | 55.8% | 51.2% |
| Interquartile Range (IQR) | 14.9% | 12.6% |
| Standard Deviation (Sample) | 14.3% | 13.1% |
| Standard Deviation (Population) | 14.1% | 13.0% |
Similar Demographics by Married-couple Households
Demographics Similar to Immigrants from Denmark by Married-couple Households
In terms of married-couple households, the demographic groups most similar to Immigrants from Denmark are Immigrants from Iraq (47.3%, a difference of 0.020%), Immigrants from Hungary (47.3%, a difference of 0.020%), Immigrants from Peru (47.3%, a difference of 0.030%), Celtic (47.3%, a difference of 0.050%), and Immigrants from Ukraine (47.3%, a difference of 0.070%).
| Demographics | Rating | Rank | Married-couple Households |
| Zimbabweans | 89.2 /100 | #124 | Excellent 47.4% |
| Australians | 89.0 /100 | #125 | Excellent 47.4% |
| Pakistanis | 88.6 /100 | #126 | Excellent 47.3% |
| Celtics | 88.1 /100 | #127 | Excellent 47.3% |
| Immigrants | Peru | 87.9 /100 | #128 | Excellent 47.3% |
| Immigrants | Iraq | 87.8 /100 | #129 | Excellent 47.3% |
| Immigrants | Hungary | 87.8 /100 | #130 | Excellent 47.3% |
| Immigrants | Denmark | 87.5 /100 | #131 | Excellent 47.3% |
| Immigrants | Ukraine | 86.7 /100 | #132 | Excellent 47.3% |
| South Africans | 86.4 /100 | #133 | Excellent 47.3% |
| Immigrants | Greece | 86.0 /100 | #134 | Excellent 47.2% |
| Immigrants | Argentina | 86.0 /100 | #135 | Excellent 47.2% |
| New Zealanders | 85.3 /100 | #136 | Excellent 47.2% |
| Immigrants | Malaysia | 85.2 /100 | #137 | Excellent 47.2% |
| Immigrants | Afghanistan | 85.1 /100 | #138 | Excellent 47.2% |
Demographics Similar to Tlingit-Haida by Married-couple Households
In terms of married-couple households, the demographic groups most similar to Tlingit-Haida are Immigrants from Thailand (45.2%, a difference of 0.050%), Immigrants from Laos (45.1%, a difference of 0.050%), Nicaraguan (45.2%, a difference of 0.080%), Immigrants from the Azores (45.2%, a difference of 0.090%), and Panamanian (45.2%, a difference of 0.11%).
| Demographics | Rating | Rank | Married-couple Households |
| Japanese | 5.7 /100 | #214 | Tragic 45.2% |
| Immigrants | Nepal | 5.6 /100 | #215 | Tragic 45.2% |
| Immigrants | Portugal | 5.6 /100 | #216 | Tragic 45.2% |
| Panamanians | 5.5 /100 | #217 | Tragic 45.2% |
| Immigrants | Azores | 5.3 /100 | #218 | Tragic 45.2% |
| Nicaraguans | 5.3 /100 | #219 | Tragic 45.2% |
| Immigrants | Thailand | 5.1 /100 | #220 | Tragic 45.2% |
| Tlingit-Haida | 4.9 /100 | #221 | Tragic 45.1% |
| Immigrants | Laos | 4.6 /100 | #222 | Tragic 45.1% |
| Immigrants | Cambodia | 2.7 /100 | #223 | Tragic 44.9% |
| Immigrants | Micronesia | 2.6 /100 | #224 | Tragic 44.9% |
| Dutch West Indians | 2.6 /100 | #225 | Tragic 44.9% |
| Alsatians | 2.3 /100 | #226 | Tragic 44.8% |
| Salvadorans | 1.9 /100 | #227 | Tragic 44.7% |
| Kenyans | 1.7 /100 | #228 | Tragic 44.7% |