Immigrants from Croatia vs White/Caucasian 8th Grade
COMPARE
Immigrants from Croatia
White/Caucasian
8th Grade
8th Grade Comparison
Immigrants from Croatia
Whites/Caucasians
96.2%
8TH GRADE
96.0/ 100
METRIC RATING
117th/ 347
METRIC RANK
96.7%
8TH GRADE
99.8/ 100
METRIC RATING
62nd/ 347
METRIC RANK
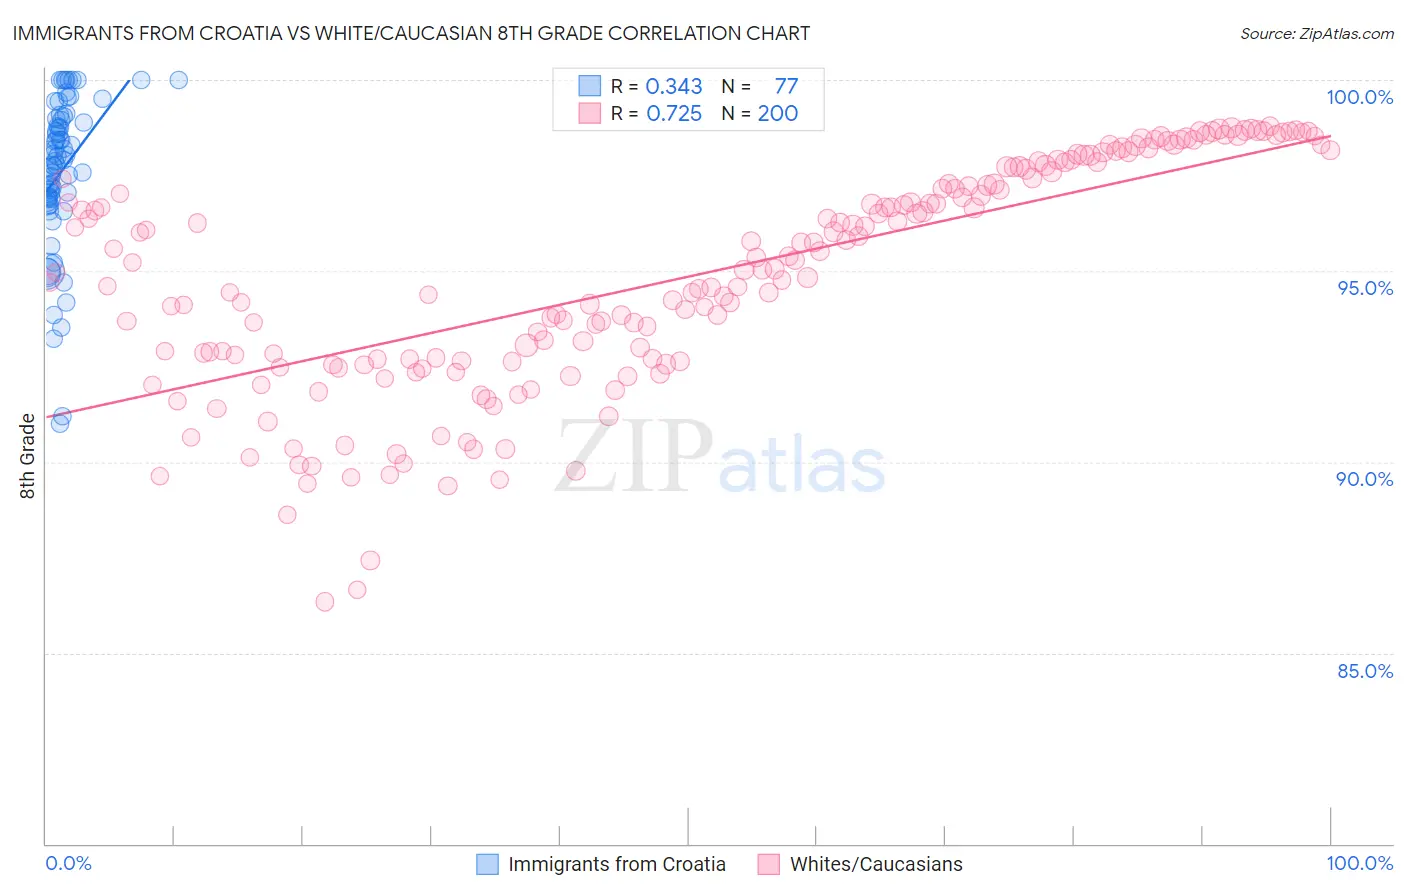
Immigrants from Croatia vs White/Caucasian 8th Grade Correlation Chart
The statistical analysis conducted on geographies consisting of 132,548,291 people shows a mild positive correlation between the proportion of Immigrants from Croatia and percentage of population with at least 8th grade education in the United States with a correlation coefficient (R) of 0.343 and weighted average of 96.2%. Similarly, the statistical analysis conducted on geographies consisting of 585,246,768 people shows a strong positive correlation between the proportion of Whites/Caucasians and percentage of population with at least 8th grade education in the United States with a correlation coefficient (R) of 0.725 and weighted average of 96.7%, a difference of 0.45%.
8th Grade Correlation Summary
| Measurement | Immigrants from Croatia | White/Caucasian |
| Minimum | 91.0% | 86.3% |
| Maximum | 100.0% | 98.8% |
| Range | 9.0% | 12.4% |
| Mean | 97.6% | 94.9% |
| Median | 97.9% | 95.0% |
| Interquartile 25% (IQ1) | 96.9% | 92.6% |
| Interquartile 75% (IQ3) | 99.0% | 97.5% |
| Interquartile Range (IQR) | 2.1% | 4.9% |
| Standard Deviation (Sample) | 2.0% | 2.9% |
| Standard Deviation (Population) | 1.9% | 2.9% |
Similar Demographics by 8th Grade
Demographics Similar to Immigrants from Croatia by 8th Grade
In terms of 8th grade, the demographic groups most similar to Immigrants from Croatia are Nonimmigrants (96.2%, a difference of 0.0%), Immigrants from Norway (96.2%, a difference of 0.010%), Immigrants from Japan (96.2%, a difference of 0.020%), Immigrants from Moldova (96.2%, a difference of 0.020%), and Syrian (96.3%, a difference of 0.030%).
| Demographics | Rating | Rank | 8th Grade |
| Cajuns | 97.1 /100 | #110 | Exceptional 96.3% |
| Shoshone | 96.8 /100 | #111 | Exceptional 96.3% |
| Syrians | 96.7 /100 | #112 | Exceptional 96.3% |
| Immigrants | Zimbabwe | 96.7 /100 | #113 | Exceptional 96.3% |
| Immigrants | Japan | 96.5 /100 | #114 | Exceptional 96.2% |
| Immigrants | Moldova | 96.5 /100 | #115 | Exceptional 96.2% |
| Immigrants | Nonimmigrants | 96.0 /100 | #116 | Exceptional 96.2% |
| Immigrants | Croatia | 96.0 /100 | #117 | Exceptional 96.2% |
| Immigrants | Norway | 95.7 /100 | #118 | Exceptional 96.2% |
| Immigrants | Switzerland | 95.3 /100 | #119 | Exceptional 96.2% |
| Immigrants | France | 95.3 /100 | #120 | Exceptional 96.2% |
| Immigrants | Bulgaria | 95.3 /100 | #121 | Exceptional 96.2% |
| Immigrants | Europe | 95.3 /100 | #122 | Exceptional 96.2% |
| Filipinos | 94.6 /100 | #123 | Exceptional 96.2% |
| Palestinians | 94.6 /100 | #124 | Exceptional 96.2% |
Demographics Similar to Whites/Caucasians by 8th Grade
In terms of 8th grade, the demographic groups most similar to Whites/Caucasians are Immigrants from Austria (96.7%, a difference of 0.010%), Immigrants from North America (96.7%, a difference of 0.020%), Immigrants from Northern Europe (96.7%, a difference of 0.020%), Ukrainian (96.7%, a difference of 0.020%), and Immigrants from India (96.6%, a difference of 0.020%).
| Demographics | Rating | Rank | 8th Grade |
| Russians | 99.8 /100 | #55 | Exceptional 96.7% |
| Australians | 99.8 /100 | #56 | Exceptional 96.7% |
| Macedonians | 99.8 /100 | #57 | Exceptional 96.7% |
| Immigrants | Canada | 99.8 /100 | #58 | Exceptional 96.7% |
| Immigrants | North America | 99.8 /100 | #59 | Exceptional 96.7% |
| Immigrants | Northern Europe | 99.8 /100 | #60 | Exceptional 96.7% |
| Immigrants | Austria | 99.8 /100 | #61 | Exceptional 96.7% |
| Whites/Caucasians | 99.8 /100 | #62 | Exceptional 96.7% |
| Ukrainians | 99.7 /100 | #63 | Exceptional 96.7% |
| Immigrants | India | 99.7 /100 | #64 | Exceptional 96.6% |
| Native Hawaiians | 99.7 /100 | #65 | Exceptional 96.6% |
| Canadians | 99.7 /100 | #66 | Exceptional 96.6% |
| Iranians | 99.7 /100 | #67 | Exceptional 96.6% |
| Creek | 99.7 /100 | #68 | Exceptional 96.6% |
| Americans | 99.7 /100 | #69 | Exceptional 96.6% |