Immigrants from Belgium vs Sri Lankan Family Households
COMPARE
Immigrants from Belgium
Sri Lankan
Family Households
Family Households Comparison
Immigrants from Belgium
Sri Lankans
63.0%
FAMILY HOUSEHOLDS
0.2/ 100
METRIC RATING
278th/ 347
METRIC RANK
67.7%
FAMILY HOUSEHOLDS
100.0/ 100
METRIC RATING
22nd/ 347
METRIC RANK
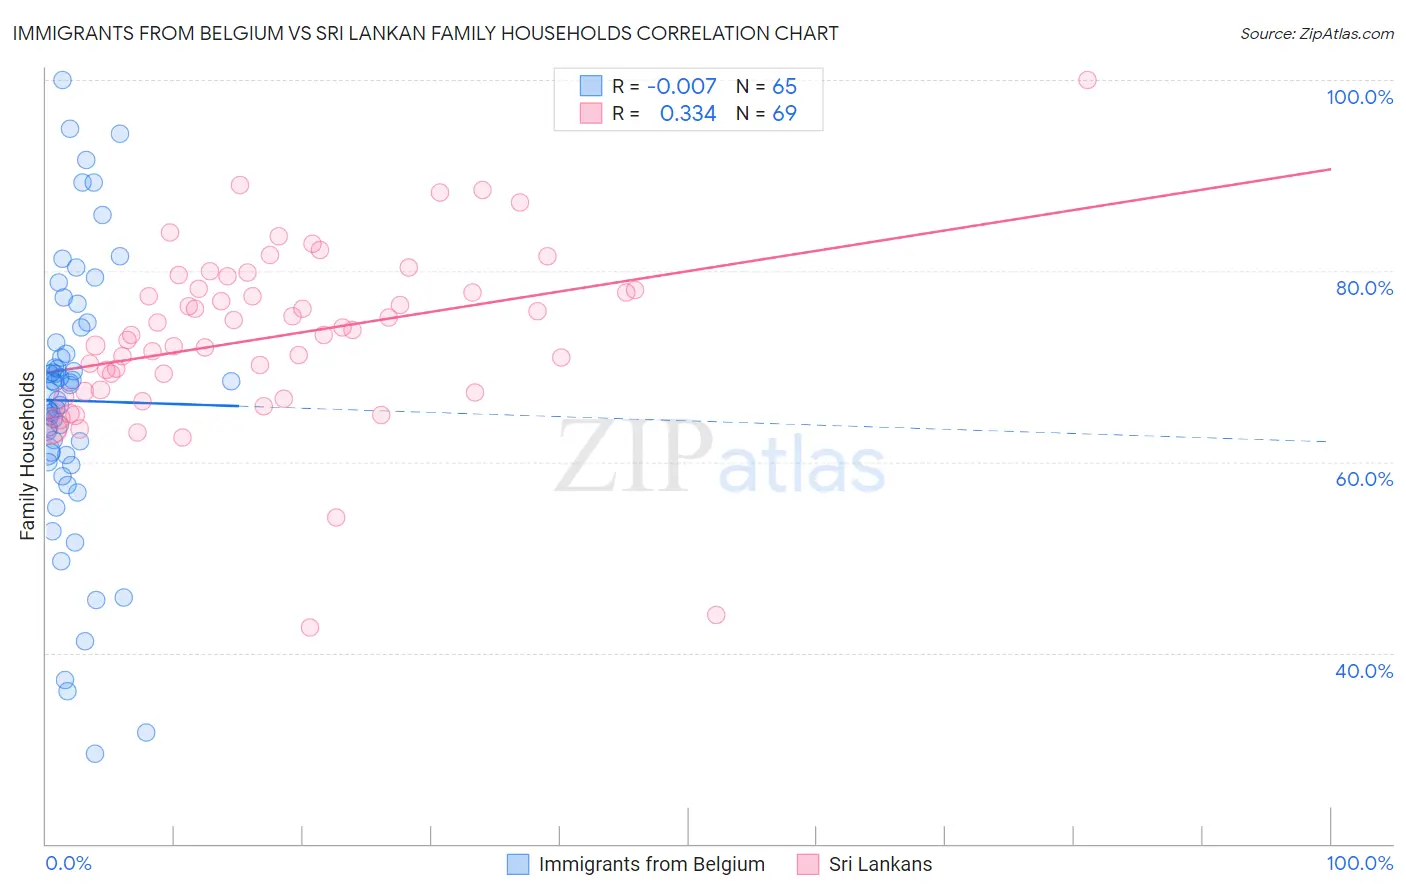
Immigrants from Belgium vs Sri Lankan Family Households Correlation Chart
The statistical analysis conducted on geographies consisting of 146,698,570 people shows no correlation between the proportion of Immigrants from Belgium and percentage of family households in the United States with a correlation coefficient (R) of -0.007 and weighted average of 63.0%. Similarly, the statistical analysis conducted on geographies consisting of 440,096,493 people shows a mild positive correlation between the proportion of Sri Lankans and percentage of family households in the United States with a correlation coefficient (R) of 0.334 and weighted average of 67.7%, a difference of 7.5%.
Family Households Correlation Summary
| Measurement | Immigrants from Belgium | Sri Lankan |
| Minimum | 29.4% | 42.7% |
| Maximum | 100.0% | 100.0% |
| Range | 70.6% | 57.3% |
| Mean | 66.4% | 73.1% |
| Median | 67.5% | 73.3% |
| Interquartile 25% (IQ1) | 60.4% | 67.3% |
| Interquartile 75% (IQ3) | 73.3% | 78.0% |
| Interquartile Range (IQR) | 12.9% | 10.7% |
| Standard Deviation (Sample) | 14.5% | 9.3% |
| Standard Deviation (Population) | 14.4% | 9.2% |
Similar Demographics by Family Households
Demographics Similar to Immigrants from Belgium by Family Households
In terms of family households, the demographic groups most similar to Immigrants from Belgium are Ottawa (63.0%, a difference of 0.040%), Immigrants from Yemen (63.0%, a difference of 0.040%), Immigrants from Bulgaria (63.0%, a difference of 0.050%), Serbian (63.0%, a difference of 0.090%), and Lumbee (63.1%, a difference of 0.10%).
| Demographics | Rating | Rank | Family Households |
| Immigrants | Croatia | 0.3 /100 | #271 | Tragic 63.1% |
| Immigrants | Turkey | 0.3 /100 | #272 | Tragic 63.1% |
| Immigrants | Kazakhstan | 0.3 /100 | #273 | Tragic 63.1% |
| Lumbee | 0.3 /100 | #274 | Tragic 63.1% |
| West Indians | 0.3 /100 | #275 | Tragic 63.1% |
| Serbians | 0.3 /100 | #276 | Tragic 63.0% |
| Ottawa | 0.3 /100 | #277 | Tragic 63.0% |
| Immigrants | Belgium | 0.2 /100 | #278 | Tragic 63.0% |
| Immigrants | Yemen | 0.2 /100 | #279 | Tragic 63.0% |
| Immigrants | Bulgaria | 0.2 /100 | #280 | Tragic 63.0% |
| Estonians | 0.2 /100 | #281 | Tragic 62.9% |
| New Zealanders | 0.1 /100 | #282 | Tragic 62.9% |
| Immigrants | Denmark | 0.1 /100 | #283 | Tragic 62.9% |
| Australians | 0.1 /100 | #284 | Tragic 62.8% |
| Mongolians | 0.1 /100 | #285 | Tragic 62.8% |
Demographics Similar to Sri Lankans by Family Households
In terms of family households, the demographic groups most similar to Sri Lankans are Cuban (67.7%, a difference of 0.040%), Inupiat (67.8%, a difference of 0.090%), Immigrants from Pakistan (67.7%, a difference of 0.090%), Samoan (67.9%, a difference of 0.33%), and Immigrants from South Eastern Asia (67.5%, a difference of 0.37%).
| Demographics | Rating | Rank | Family Households |
| Assyrians/Chaldeans/Syriacs | 100.0 /100 | #15 | Exceptional 68.2% |
| Immigrants | Vietnam | 100.0 /100 | #16 | Exceptional 68.2% |
| Chinese | 100.0 /100 | #17 | Exceptional 68.1% |
| Immigrants | Taiwan | 100.0 /100 | #18 | Exceptional 68.0% |
| Samoans | 100.0 /100 | #19 | Exceptional 67.9% |
| Inupiat | 100.0 /100 | #20 | Exceptional 67.8% |
| Cubans | 100.0 /100 | #21 | Exceptional 67.7% |
| Sri Lankans | 100.0 /100 | #22 | Exceptional 67.7% |
| Immigrants | Pakistan | 100.0 /100 | #23 | Exceptional 67.7% |
| Immigrants | South Eastern Asia | 100.0 /100 | #24 | Exceptional 67.5% |
| Immigrants | Nicaragua | 100.0 /100 | #25 | Exceptional 67.5% |
| Immigrants | India | 100.0 /100 | #26 | Exceptional 67.4% |
| Hispanics or Latinos | 100.0 /100 | #27 | Exceptional 67.4% |
| Hawaiians | 100.0 /100 | #28 | Exceptional 67.4% |
| Nicaraguans | 100.0 /100 | #29 | Exceptional 67.4% |