Immigrants from Western Europe vs Moroccan Family Households
COMPARE
Immigrants from Western Europe
Moroccan
Family Households
Family Households Comparison
Immigrants from Western Europe
Moroccans
63.2%
FAMILY HOUSEHOLDS
0.6/ 100
METRIC RATING
259th/ 347
METRIC RANK
61.9%
FAMILY HOUSEHOLDS
0.0/ 100
METRIC RATING
315th/ 347
METRIC RANK
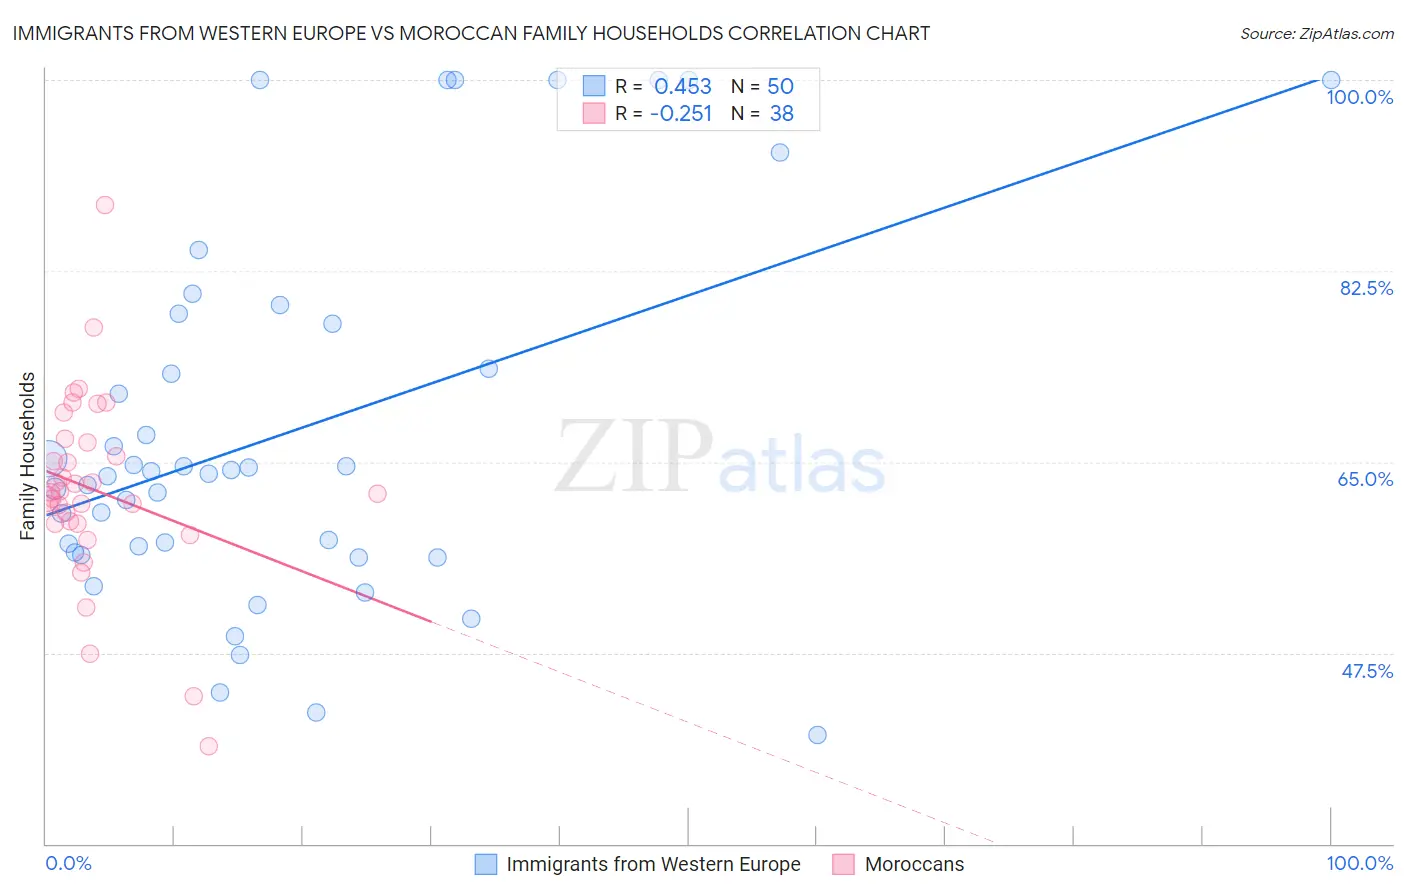
Immigrants from Western Europe vs Moroccan Family Households Correlation Chart
The statistical analysis conducted on geographies consisting of 493,828,314 people shows a moderate positive correlation between the proportion of Immigrants from Western Europe and percentage of family households in the United States with a correlation coefficient (R) of 0.453 and weighted average of 63.2%. Similarly, the statistical analysis conducted on geographies consisting of 201,760,179 people shows a weak negative correlation between the proportion of Moroccans and percentage of family households in the United States with a correlation coefficient (R) of -0.251 and weighted average of 61.9%, a difference of 2.1%.
Family Households Correlation Summary
| Measurement | Immigrants from Western Europe | Moroccan |
| Minimum | 40.0% | 38.9% |
| Maximum | 100.0% | 88.5% |
| Range | 60.0% | 49.6% |
| Mean | 67.6% | 62.4% |
| Median | 64.0% | 62.1% |
| Interquartile 25% (IQ1) | 56.7% | 59.3% |
| Interquartile 75% (IQ3) | 77.7% | 66.7% |
| Interquartile Range (IQR) | 21.0% | 7.4% |
| Standard Deviation (Sample) | 16.8% | 8.7% |
| Standard Deviation (Population) | 16.6% | 8.6% |
Similar Demographics by Family Households
Demographics Similar to Immigrants from Western Europe by Family Households
In terms of family households, the demographic groups most similar to Immigrants from Western Europe are Immigrants from Barbados (63.2%, a difference of 0.010%), Cypriot (63.2%, a difference of 0.020%), Immigrants from Russia (63.2%, a difference of 0.040%), Immigrants from Ireland (63.2%, a difference of 0.050%), and Icelander (63.3%, a difference of 0.070%).
| Demographics | Rating | Rank | Family Households |
| Bahamians | 1.1 /100 | #252 | Tragic 63.3% |
| Immigrants | Dominican Republic | 1.0 /100 | #253 | Tragic 63.3% |
| Slovaks | 1.0 /100 | #254 | Tragic 63.3% |
| Potawatomi | 1.0 /100 | #255 | Tragic 63.3% |
| Luxembourgers | 0.9 /100 | #256 | Tragic 63.3% |
| Icelanders | 0.8 /100 | #257 | Tragic 63.3% |
| Immigrants | Barbados | 0.7 /100 | #258 | Tragic 63.2% |
| Immigrants | Western Europe | 0.6 /100 | #259 | Tragic 63.2% |
| Cypriots | 0.6 /100 | #260 | Tragic 63.2% |
| Immigrants | Russia | 0.6 /100 | #261 | Tragic 63.2% |
| Immigrants | Ireland | 0.6 /100 | #262 | Tragic 63.2% |
| Cheyenne | 0.5 /100 | #263 | Tragic 63.2% |
| Kenyans | 0.5 /100 | #264 | Tragic 63.2% |
| Colville | 0.5 /100 | #265 | Tragic 63.2% |
| Immigrants | Western Africa | 0.5 /100 | #266 | Tragic 63.1% |
Demographics Similar to Moroccans by Family Households
In terms of family households, the demographic groups most similar to Moroccans are Immigrants from Cabo Verde (61.9%, a difference of 0.040%), Immigrants from Middle Africa (61.9%, a difference of 0.040%), Immigrants from Bosnia and Herzegovina (61.9%, a difference of 0.080%), Liberian (62.0%, a difference of 0.090%), and Immigrants from Latvia (62.0%, a difference of 0.10%).
| Demographics | Rating | Rank | Family Households |
| Chippewa | 0.0 /100 | #308 | Tragic 62.1% |
| Sub-Saharan Africans | 0.0 /100 | #309 | Tragic 62.1% |
| Immigrants | Liberia | 0.0 /100 | #310 | Tragic 62.0% |
| Immigrants | Morocco | 0.0 /100 | #311 | Tragic 62.0% |
| Immigrants | Latvia | 0.0 /100 | #312 | Tragic 62.0% |
| Liberians | 0.0 /100 | #313 | Tragic 62.0% |
| Immigrants | Cabo Verde | 0.0 /100 | #314 | Tragic 61.9% |
| Moroccans | 0.0 /100 | #315 | Tragic 61.9% |
| Immigrants | Middle Africa | 0.0 /100 | #316 | Tragic 61.9% |
| Immigrants | Bosnia and Herzegovina | 0.0 /100 | #317 | Tragic 61.9% |
| Alaskan Athabascans | 0.0 /100 | #318 | Tragic 61.8% |
| Cape Verdeans | 0.0 /100 | #319 | Tragic 61.8% |
| Ugandans | 0.0 /100 | #320 | Tragic 61.7% |
| Alsatians | 0.0 /100 | #321 | Tragic 61.7% |
| Immigrants | Serbia | 0.0 /100 | #322 | Tragic 61.6% |