Immigrants from Belgium vs U.S. Virgin Islander Family Households
COMPARE
Immigrants from Belgium
U.S. Virgin Islander
Family Households
Family Households Comparison
Immigrants from Belgium
U.S. Virgin Islanders
63.0%
FAMILY HOUSEHOLDS
0.2/ 100
METRIC RATING
278th/ 347
METRIC RANK
62.6%
FAMILY HOUSEHOLDS
0.0/ 100
METRIC RATING
291st/ 347
METRIC RANK
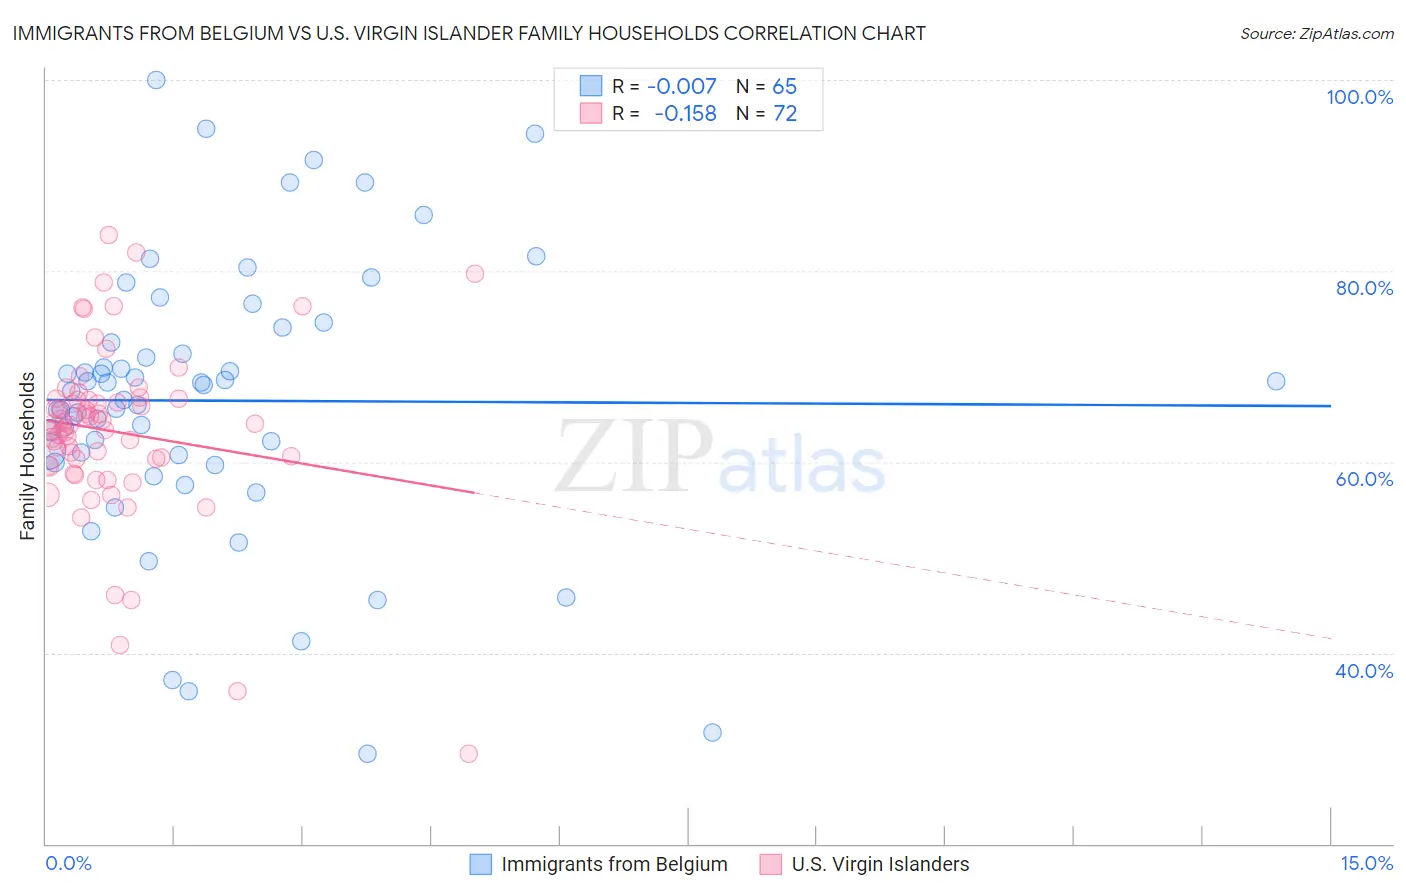
Immigrants from Belgium vs U.S. Virgin Islander Family Households Correlation Chart
The statistical analysis conducted on geographies consisting of 146,698,570 people shows no correlation between the proportion of Immigrants from Belgium and percentage of family households in the United States with a correlation coefficient (R) of -0.007 and weighted average of 63.0%. Similarly, the statistical analysis conducted on geographies consisting of 87,507,759 people shows a poor negative correlation between the proportion of U.S. Virgin Islanders and percentage of family households in the United States with a correlation coefficient (R) of -0.158 and weighted average of 62.6%, a difference of 0.60%.
Family Households Correlation Summary
| Measurement | Immigrants from Belgium | U.S. Virgin Islander |
| Minimum | 29.4% | 29.5% |
| Maximum | 100.0% | 83.8% |
| Range | 70.6% | 54.3% |
| Mean | 66.4% | 63.2% |
| Median | 67.5% | 63.9% |
| Interquartile 25% (IQ1) | 60.4% | 59.9% |
| Interquartile 75% (IQ3) | 73.3% | 66.5% |
| Interquartile Range (IQR) | 12.9% | 6.6% |
| Standard Deviation (Sample) | 14.5% | 9.1% |
| Standard Deviation (Population) | 14.4% | 9.1% |
Demographics Similar to Immigrants from Belgium and U.S. Virgin Islanders by Family Households
In terms of family households, the demographic groups most similar to Immigrants from Belgium are Ottawa (63.0%, a difference of 0.040%), Immigrants from Yemen (63.0%, a difference of 0.040%), Immigrants from Bulgaria (63.0%, a difference of 0.050%), Serbian (63.0%, a difference of 0.090%), and Lumbee (63.1%, a difference of 0.10%). Similarly, the demographic groups most similar to U.S. Virgin Islanders are Immigrants from Grenada (62.6%, a difference of 0.050%), Immigrants from Burma/Myanmar (62.6%, a difference of 0.050%), Immigrants from Nepal (62.7%, a difference of 0.13%), Immigrants from Sweden (62.5%, a difference of 0.18%), and Immigrants from Uganda (62.7%, a difference of 0.22%).
| Demographics | Rating | Rank | Family Households |
| Lumbee | 0.3 /100 | #274 | Tragic 63.1% |
| West Indians | 0.3 /100 | #275 | Tragic 63.1% |
| Serbians | 0.3 /100 | #276 | Tragic 63.0% |
| Ottawa | 0.3 /100 | #277 | Tragic 63.0% |
| Immigrants | Belgium | 0.2 /100 | #278 | Tragic 63.0% |
| Immigrants | Yemen | 0.2 /100 | #279 | Tragic 63.0% |
| Immigrants | Bulgaria | 0.2 /100 | #280 | Tragic 63.0% |
| Estonians | 0.2 /100 | #281 | Tragic 62.9% |
| New Zealanders | 0.1 /100 | #282 | Tragic 62.9% |
| Immigrants | Denmark | 0.1 /100 | #283 | Tragic 62.9% |
| Australians | 0.1 /100 | #284 | Tragic 62.8% |
| Mongolians | 0.1 /100 | #285 | Tragic 62.8% |
| British West Indians | 0.1 /100 | #286 | Tragic 62.8% |
| Latvians | 0.1 /100 | #287 | Tragic 62.8% |
| Immigrants | Uganda | 0.1 /100 | #288 | Tragic 62.7% |
| Immigrants | Nepal | 0.1 /100 | #289 | Tragic 62.7% |
| Immigrants | Grenada | 0.0 /100 | #290 | Tragic 62.6% |
| U.S. Virgin Islanders | 0.0 /100 | #291 | Tragic 62.6% |
| Immigrants | Burma/Myanmar | 0.0 /100 | #292 | Tragic 62.6% |
| Immigrants | Sweden | 0.0 /100 | #293 | Tragic 62.5% |
| Barbadians | 0.0 /100 | #294 | Tragic 62.5% |