Immigrants from Belgium vs Bulgarian Family Households
COMPARE
Immigrants from Belgium
Bulgarian
Family Households
Family Households Comparison
Immigrants from Belgium
Bulgarians
63.0%
FAMILY HOUSEHOLDS
0.2/ 100
METRIC RATING
278th/ 347
METRIC RANK
63.6%
FAMILY HOUSEHOLDS
3.4/ 100
METRIC RATING
229th/ 347
METRIC RANK
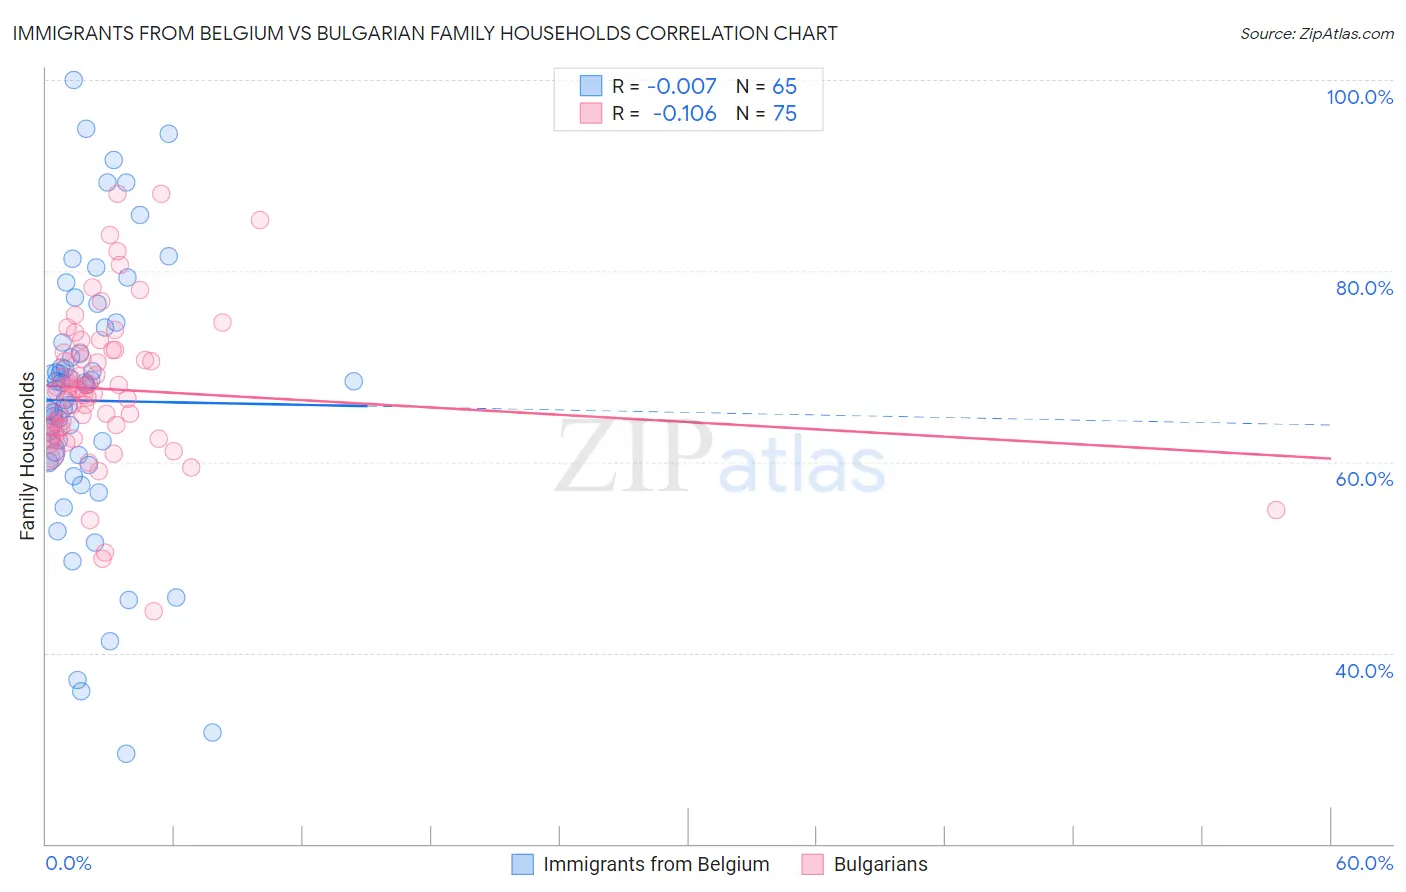
Immigrants from Belgium vs Bulgarian Family Households Correlation Chart
The statistical analysis conducted on geographies consisting of 146,698,570 people shows no correlation between the proportion of Immigrants from Belgium and percentage of family households in the United States with a correlation coefficient (R) of -0.007 and weighted average of 63.0%. Similarly, the statistical analysis conducted on geographies consisting of 205,566,238 people shows a poor negative correlation between the proportion of Bulgarians and percentage of family households in the United States with a correlation coefficient (R) of -0.106 and weighted average of 63.6%, a difference of 0.93%.
Family Households Correlation Summary
| Measurement | Immigrants from Belgium | Bulgarian |
| Minimum | 29.4% | 44.3% |
| Maximum | 100.0% | 88.1% |
| Range | 70.6% | 43.8% |
| Mean | 66.4% | 67.6% |
| Median | 67.5% | 67.4% |
| Interquartile 25% (IQ1) | 60.4% | 62.8% |
| Interquartile 75% (IQ3) | 73.3% | 71.5% |
| Interquartile Range (IQR) | 12.9% | 8.7% |
| Standard Deviation (Sample) | 14.5% | 8.0% |
| Standard Deviation (Population) | 14.4% | 7.9% |
Similar Demographics by Family Households
Demographics Similar to Immigrants from Belgium by Family Households
In terms of family households, the demographic groups most similar to Immigrants from Belgium are Ottawa (63.0%, a difference of 0.040%), Immigrants from Yemen (63.0%, a difference of 0.040%), Immigrants from Bulgaria (63.0%, a difference of 0.050%), Serbian (63.0%, a difference of 0.090%), and Lumbee (63.1%, a difference of 0.10%).
| Demographics | Rating | Rank | Family Households |
| Immigrants | Croatia | 0.3 /100 | #271 | Tragic 63.1% |
| Immigrants | Turkey | 0.3 /100 | #272 | Tragic 63.1% |
| Immigrants | Kazakhstan | 0.3 /100 | #273 | Tragic 63.1% |
| Lumbee | 0.3 /100 | #274 | Tragic 63.1% |
| West Indians | 0.3 /100 | #275 | Tragic 63.1% |
| Serbians | 0.3 /100 | #276 | Tragic 63.0% |
| Ottawa | 0.3 /100 | #277 | Tragic 63.0% |
| Immigrants | Belgium | 0.2 /100 | #278 | Tragic 63.0% |
| Immigrants | Yemen | 0.2 /100 | #279 | Tragic 63.0% |
| Immigrants | Bulgaria | 0.2 /100 | #280 | Tragic 63.0% |
| Estonians | 0.2 /100 | #281 | Tragic 62.9% |
| New Zealanders | 0.1 /100 | #282 | Tragic 62.9% |
| Immigrants | Denmark | 0.1 /100 | #283 | Tragic 62.9% |
| Australians | 0.1 /100 | #284 | Tragic 62.8% |
| Mongolians | 0.1 /100 | #285 | Tragic 62.8% |
Demographics Similar to Bulgarians by Family Households
In terms of family households, the demographic groups most similar to Bulgarians are Blackfeet (63.6%, a difference of 0.020%), Immigrants from Brazil (63.6%, a difference of 0.040%), Immigrants from Greece (63.5%, a difference of 0.060%), Immigrants from Bahamas (63.6%, a difference of 0.070%), and Trinidadian and Tobagonian (63.6%, a difference of 0.070%).
| Demographics | Rating | Rank | Family Households |
| Immigrants | Belarus | 5.5 /100 | #222 | Tragic 63.7% |
| French Canadians | 5.4 /100 | #223 | Tragic 63.7% |
| Turks | 4.5 /100 | #224 | Tragic 63.6% |
| Immigrants | Hungary | 4.3 /100 | #225 | Tragic 63.6% |
| Immigrants | Bahamas | 4.2 /100 | #226 | Tragic 63.6% |
| Trinidadians and Tobagonians | 4.1 /100 | #227 | Tragic 63.6% |
| Blackfeet | 3.6 /100 | #228 | Tragic 63.6% |
| Bulgarians | 3.4 /100 | #229 | Tragic 63.6% |
| Immigrants | Brazil | 3.0 /100 | #230 | Tragic 63.6% |
| Immigrants | Greece | 2.9 /100 | #231 | Tragic 63.5% |
| Immigrants | Northern Africa | 2.6 /100 | #232 | Tragic 63.5% |
| Immigrants | Armenia | 2.6 /100 | #233 | Tragic 63.5% |
| Finns | 2.3 /100 | #234 | Tragic 63.5% |
| Albanians | 2.2 /100 | #235 | Tragic 63.5% |
| Ghanaians | 2.1 /100 | #236 | Tragic 63.5% |