Immigrants from Belgium vs Immigrants from Barbados Family Households
COMPARE
Immigrants from Belgium
Immigrants from Barbados
Family Households
Family Households Comparison
Immigrants from Belgium
Immigrants from Barbados
63.0%
FAMILY HOUSEHOLDS
0.2/ 100
METRIC RATING
278th/ 347
METRIC RANK
63.2%
FAMILY HOUSEHOLDS
0.7/ 100
METRIC RATING
258th/ 347
METRIC RANK
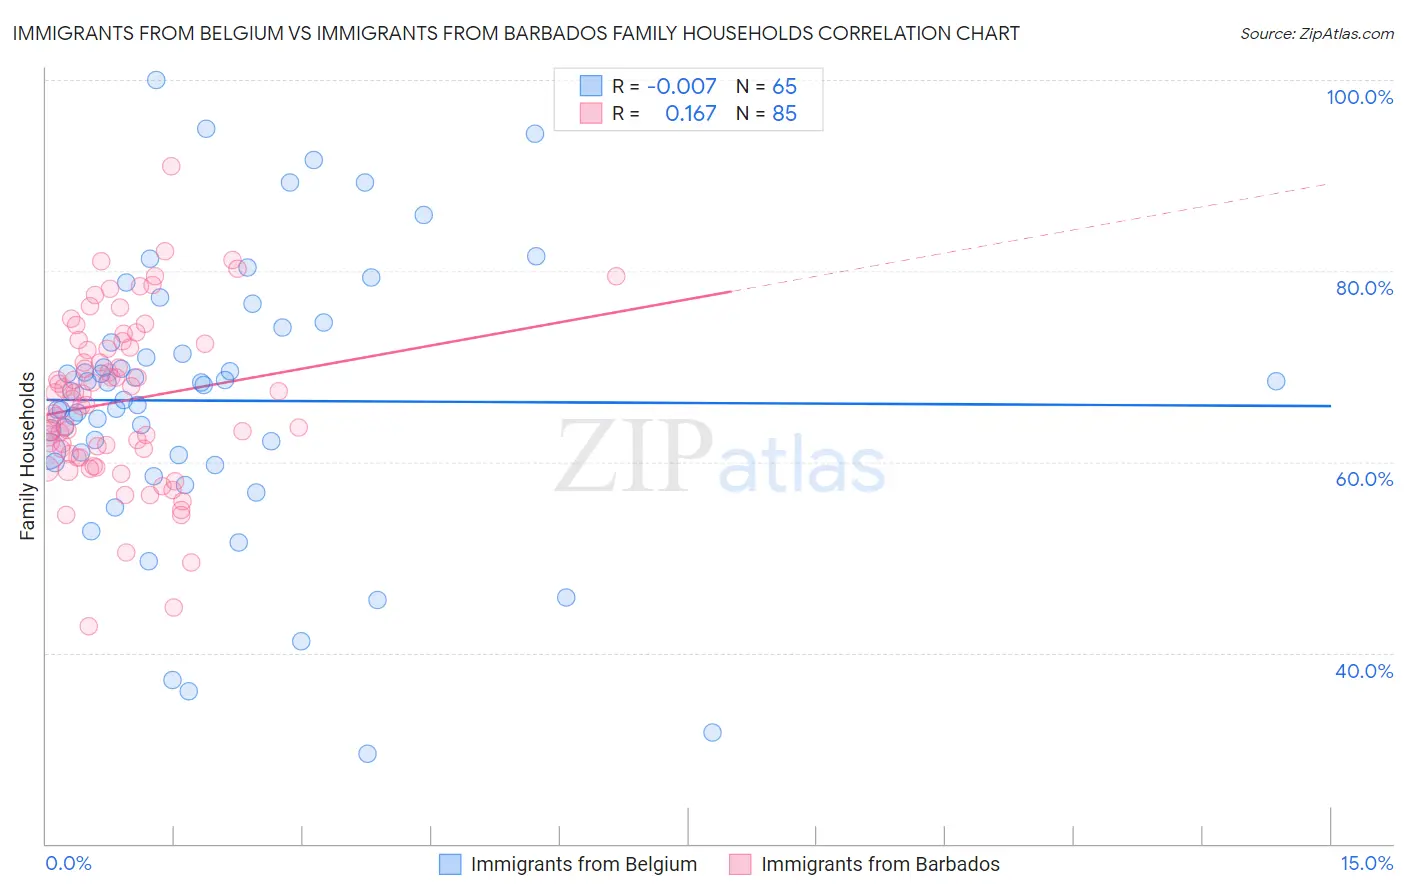
Immigrants from Belgium vs Immigrants from Barbados Family Households Correlation Chart
The statistical analysis conducted on geographies consisting of 146,698,570 people shows no correlation between the proportion of Immigrants from Belgium and percentage of family households in the United States with a correlation coefficient (R) of -0.007 and weighted average of 63.0%. Similarly, the statistical analysis conducted on geographies consisting of 112,769,646 people shows a poor positive correlation between the proportion of Immigrants from Barbados and percentage of family households in the United States with a correlation coefficient (R) of 0.167 and weighted average of 63.2%, a difference of 0.36%.
Family Households Correlation Summary
| Measurement | Immigrants from Belgium | Immigrants from Barbados |
| Minimum | 29.4% | 42.7% |
| Maximum | 100.0% | 91.0% |
| Range | 70.6% | 48.2% |
| Mean | 66.4% | 66.3% |
| Median | 67.5% | 66.6% |
| Interquartile 25% (IQ1) | 60.4% | 60.7% |
| Interquartile 75% (IQ3) | 73.3% | 72.2% |
| Interquartile Range (IQR) | 12.9% | 11.5% |
| Standard Deviation (Sample) | 14.5% | 8.7% |
| Standard Deviation (Population) | 14.4% | 8.6% |
Demographics Similar to Immigrants from Belgium and Immigrants from Barbados by Family Households
In terms of family households, the demographic groups most similar to Immigrants from Belgium are Ottawa (63.0%, a difference of 0.040%), Serbian (63.0%, a difference of 0.090%), Lumbee (63.1%, a difference of 0.10%), West Indian (63.1%, a difference of 0.10%), and Immigrants from Kazakhstan (63.1%, a difference of 0.11%). Similarly, the demographic groups most similar to Immigrants from Barbados are Immigrants from Western Europe (63.2%, a difference of 0.010%), Cypriot (63.2%, a difference of 0.030%), Immigrants from Russia (63.2%, a difference of 0.050%), Immigrants from Ireland (63.2%, a difference of 0.060%), and Cheyenne (63.2%, a difference of 0.090%).
| Demographics | Rating | Rank | Family Households |
| Immigrants | Barbados | 0.7 /100 | #258 | Tragic 63.2% |
| Immigrants | Western Europe | 0.6 /100 | #259 | Tragic 63.2% |
| Cypriots | 0.6 /100 | #260 | Tragic 63.2% |
| Immigrants | Russia | 0.6 /100 | #261 | Tragic 63.2% |
| Immigrants | Ireland | 0.6 /100 | #262 | Tragic 63.2% |
| Cheyenne | 0.5 /100 | #263 | Tragic 63.2% |
| Kenyans | 0.5 /100 | #264 | Tragic 63.2% |
| Colville | 0.5 /100 | #265 | Tragic 63.2% |
| Immigrants | Western Africa | 0.5 /100 | #266 | Tragic 63.1% |
| Israelis | 0.4 /100 | #267 | Tragic 63.1% |
| Immigrants | Singapore | 0.4 /100 | #268 | Tragic 63.1% |
| Yugoslavians | 0.4 /100 | #269 | Tragic 63.1% |
| Immigrants | Austria | 0.3 /100 | #270 | Tragic 63.1% |
| Immigrants | Croatia | 0.3 /100 | #271 | Tragic 63.1% |
| Immigrants | Turkey | 0.3 /100 | #272 | Tragic 63.1% |
| Immigrants | Kazakhstan | 0.3 /100 | #273 | Tragic 63.1% |
| Lumbee | 0.3 /100 | #274 | Tragic 63.1% |
| West Indians | 0.3 /100 | #275 | Tragic 63.1% |
| Serbians | 0.3 /100 | #276 | Tragic 63.0% |
| Ottawa | 0.3 /100 | #277 | Tragic 63.0% |
| Immigrants | Belgium | 0.2 /100 | #278 | Tragic 63.0% |