Hungarian vs Immigrants from Kazakhstan Family Households
COMPARE
Hungarian
Immigrants from Kazakhstan
Family Households
Family Households Comparison
Hungarians
Immigrants from Kazakhstan
64.9%
FAMILY HOUSEHOLDS
94.0/ 100
METRIC RATING
121st/ 347
METRIC RANK
63.1%
FAMILY HOUSEHOLDS
0.3/ 100
METRIC RATING
273rd/ 347
METRIC RANK
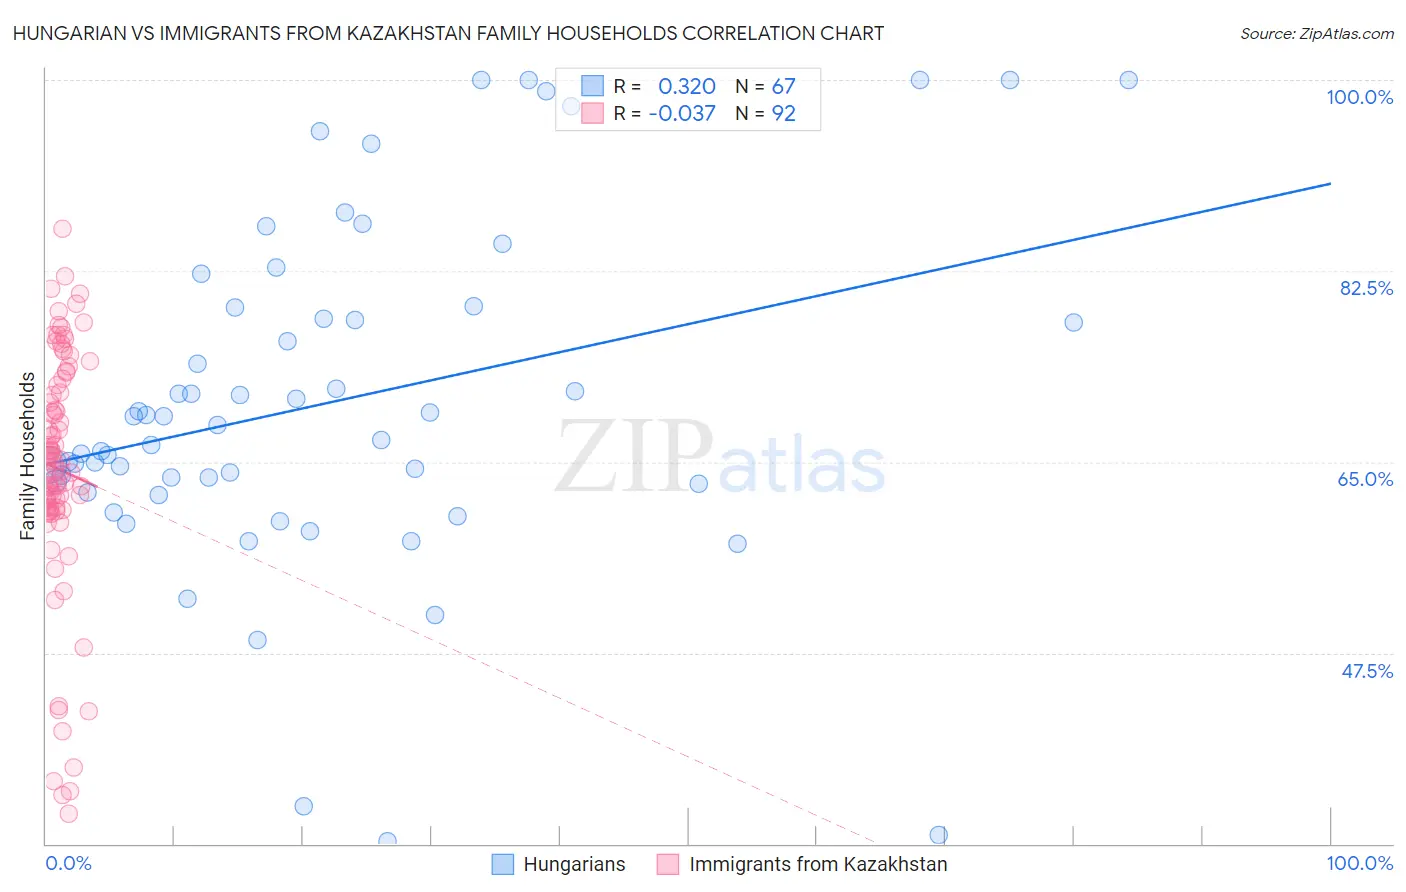
Hungarian vs Immigrants from Kazakhstan Family Households Correlation Chart
The statistical analysis conducted on geographies consisting of 485,906,921 people shows a mild positive correlation between the proportion of Hungarians and percentage of family households in the United States with a correlation coefficient (R) of 0.320 and weighted average of 64.9%. Similarly, the statistical analysis conducted on geographies consisting of 124,429,118 people shows no correlation between the proportion of Immigrants from Kazakhstan and percentage of family households in the United States with a correlation coefficient (R) of -0.037 and weighted average of 63.1%, a difference of 2.9%.
Family Households Correlation Summary
| Measurement | Hungarian | Immigrants from Kazakhstan |
| Minimum | 30.2% | 32.8% |
| Maximum | 100.0% | 86.3% |
| Range | 69.8% | 53.6% |
| Mean | 70.5% | 64.3% |
| Median | 68.4% | 65.0% |
| Interquartile 25% (IQ1) | 63.0% | 60.7% |
| Interquartile 75% (IQ3) | 79.1% | 72.3% |
| Interquartile Range (IQR) | 16.1% | 11.7% |
| Standard Deviation (Sample) | 15.7% | 11.3% |
| Standard Deviation (Population) | 15.6% | 11.3% |
Similar Demographics by Family Households
Demographics Similar to Hungarians by Family Households
In terms of family households, the demographic groups most similar to Hungarians are Immigrants from Oceania (64.9%, a difference of 0.010%), Immigrants from Eastern Asia (64.9%, a difference of 0.020%), Hmong (64.9%, a difference of 0.040%), Choctaw (64.9%, a difference of 0.040%), and Immigrants from Argentina (64.9%, a difference of 0.060%).
| Demographics | Rating | Rank | Family Households |
| Argentineans | 95.7 /100 | #114 | Exceptional 65.0% |
| Ecuadorians | 95.4 /100 | #115 | Exceptional 65.0% |
| Immigrants | Iraq | 95.4 /100 | #116 | Exceptional 65.0% |
| Cherokee | 95.3 /100 | #117 | Exceptional 65.0% |
| Dutch | 95.1 /100 | #118 | Exceptional 64.9% |
| Immigrants | Eastern Asia | 94.4 /100 | #119 | Exceptional 64.9% |
| Immigrants | Oceania | 94.2 /100 | #120 | Exceptional 64.9% |
| Hungarians | 94.0 /100 | #121 | Exceptional 64.9% |
| Hmong | 93.4 /100 | #122 | Exceptional 64.9% |
| Choctaw | 93.4 /100 | #123 | Exceptional 64.9% |
| Immigrants | Argentina | 92.8 /100 | #124 | Exceptional 64.9% |
| Immigrants | Belize | 92.7 /100 | #125 | Exceptional 64.9% |
| Panamanians | 92.4 /100 | #126 | Exceptional 64.8% |
| Immigrants | Panama | 92.0 /100 | #127 | Exceptional 64.8% |
| Italians | 91.9 /100 | #128 | Exceptional 64.8% |
Demographics Similar to Immigrants from Kazakhstan by Family Households
In terms of family households, the demographic groups most similar to Immigrants from Kazakhstan are Immigrants from Croatia (63.1%, a difference of 0.010%), Immigrants from Turkey (63.1%, a difference of 0.010%), Lumbee (63.1%, a difference of 0.010%), West Indian (63.1%, a difference of 0.010%), and Immigrants from Austria (63.1%, a difference of 0.020%).
| Demographics | Rating | Rank | Family Households |
| Immigrants | Western Africa | 0.5 /100 | #266 | Tragic 63.1% |
| Israelis | 0.4 /100 | #267 | Tragic 63.1% |
| Immigrants | Singapore | 0.4 /100 | #268 | Tragic 63.1% |
| Yugoslavians | 0.4 /100 | #269 | Tragic 63.1% |
| Immigrants | Austria | 0.3 /100 | #270 | Tragic 63.1% |
| Immigrants | Croatia | 0.3 /100 | #271 | Tragic 63.1% |
| Immigrants | Turkey | 0.3 /100 | #272 | Tragic 63.1% |
| Immigrants | Kazakhstan | 0.3 /100 | #273 | Tragic 63.1% |
| Lumbee | 0.3 /100 | #274 | Tragic 63.1% |
| West Indians | 0.3 /100 | #275 | Tragic 63.1% |
| Serbians | 0.3 /100 | #276 | Tragic 63.0% |
| Ottawa | 0.3 /100 | #277 | Tragic 63.0% |
| Immigrants | Belgium | 0.2 /100 | #278 | Tragic 63.0% |
| Immigrants | Yemen | 0.2 /100 | #279 | Tragic 63.0% |
| Immigrants | Bulgaria | 0.2 /100 | #280 | Tragic 63.0% |