Hungarian vs Iraqi Divorced or Separated
COMPARE
Hungarian
Iraqi
Divorced or Separated
Divorced or Separated Comparison
Hungarians
Iraqis
12.0%
DIVORCED OR SEPARATED
70.3/ 100
METRIC RATING
156th/ 347
METRIC RANK
11.8%
DIVORCED OR SEPARATED
94.6/ 100
METRIC RATING
120th/ 347
METRIC RANK
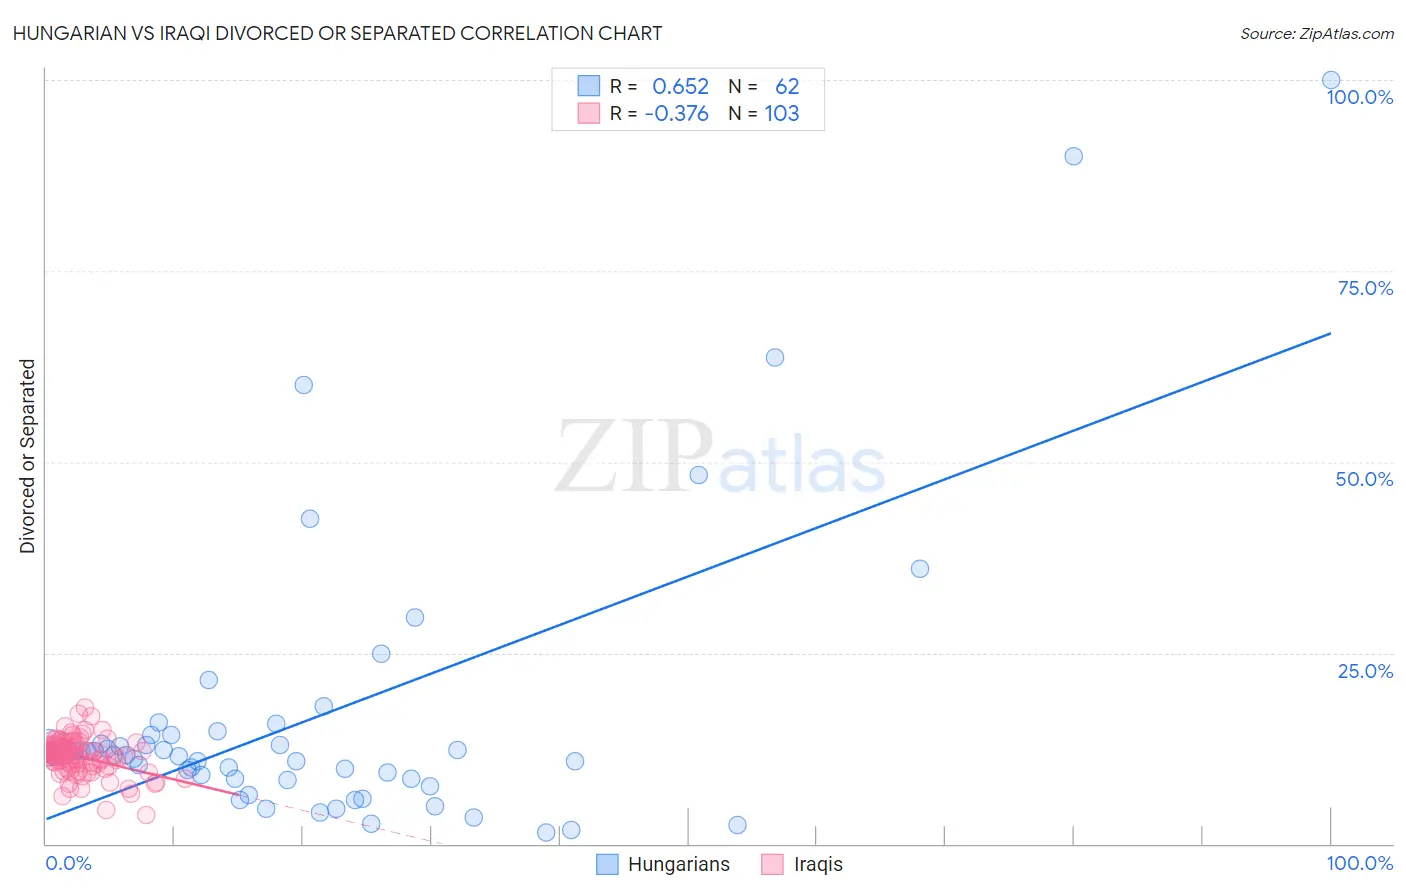
Hungarian vs Iraqi Divorced or Separated Correlation Chart
The statistical analysis conducted on geographies consisting of 485,998,803 people shows a significant positive correlation between the proportion of Hungarians and percentage of population currently divorced or separated in the United States with a correlation coefficient (R) of 0.652 and weighted average of 12.0%. Similarly, the statistical analysis conducted on geographies consisting of 170,608,468 people shows a mild negative correlation between the proportion of Iraqis and percentage of population currently divorced or separated in the United States with a correlation coefficient (R) of -0.376 and weighted average of 11.8%, a difference of 1.8%.
Divorced or Separated Correlation Summary
| Measurement | Hungarian | Iraqi |
| Minimum | 1.4% | 3.7% |
| Maximum | 100.0% | 17.9% |
| Range | 98.6% | 14.2% |
| Mean | 16.6% | 11.4% |
| Median | 11.7% | 11.7% |
| Interquartile 25% (IQ1) | 8.5% | 10.4% |
| Interquartile 75% (IQ3) | 14.2% | 12.7% |
| Interquartile Range (IQR) | 5.8% | 2.4% |
| Standard Deviation (Sample) | 19.0% | 2.4% |
| Standard Deviation (Population) | 18.8% | 2.4% |
Similar Demographics by Divorced or Separated
Demographics Similar to Hungarians by Divorced or Separated
In terms of divorced or separated, the demographic groups most similar to Hungarians are Japanese (12.0%, a difference of 0.020%), Chilean (12.0%, a difference of 0.040%), Immigrants from Brazil (12.0%, a difference of 0.060%), Austrian (12.0%, a difference of 0.080%), and Immigrants from Hungary (11.9%, a difference of 0.15%).
| Demographics | Rating | Rank | Divorced or Separated |
| Immigrants | Oceania | 77.7 /100 | #149 | Good 11.9% |
| Immigrants | Portugal | 77.3 /100 | #150 | Good 11.9% |
| Czechs | 76.4 /100 | #151 | Good 11.9% |
| Immigrants | Hungary | 73.7 /100 | #152 | Good 11.9% |
| Austrians | 72.2 /100 | #153 | Good 12.0% |
| Chileans | 71.3 /100 | #154 | Good 12.0% |
| Japanese | 70.9 /100 | #155 | Good 12.0% |
| Hungarians | 70.3 /100 | #156 | Good 12.0% |
| Immigrants | Brazil | 68.8 /100 | #157 | Good 12.0% |
| Icelanders | 66.0 /100 | #158 | Good 12.0% |
| Immigrants | Barbados | 66.0 /100 | #159 | Good 12.0% |
| Immigrants | Scotland | 65.8 /100 | #160 | Good 12.0% |
| Marshallese | 64.6 /100 | #161 | Good 12.0% |
| Samoans | 64.3 /100 | #162 | Good 12.0% |
| Navajo | 63.9 /100 | #163 | Good 12.0% |
Demographics Similar to Iraqis by Divorced or Separated
In terms of divorced or separated, the demographic groups most similar to Iraqis are Romanian (11.8%, a difference of 0.010%), Syrian (11.7%, a difference of 0.090%), Immigrants from Uganda (11.7%, a difference of 0.13%), Ecuadorian (11.7%, a difference of 0.13%), and Menominee (11.8%, a difference of 0.13%).
| Demographics | Rating | Rank | Divorced or Separated |
| Estonians | 96.6 /100 | #113 | Exceptional 11.7% |
| Immigrants | Norway | 95.9 /100 | #114 | Exceptional 11.7% |
| Lithuanians | 95.7 /100 | #115 | Exceptional 11.7% |
| Immigrants | Iraq | 95.4 /100 | #116 | Exceptional 11.7% |
| Immigrants | Uganda | 95.3 /100 | #117 | Exceptional 11.7% |
| Ecuadorians | 95.3 /100 | #118 | Exceptional 11.7% |
| Syrians | 95.1 /100 | #119 | Exceptional 11.7% |
| Iraqis | 94.6 /100 | #120 | Exceptional 11.8% |
| Romanians | 94.5 /100 | #121 | Exceptional 11.8% |
| Menominee | 93.8 /100 | #122 | Exceptional 11.8% |
| Immigrants | Immigrants | 93.7 /100 | #123 | Exceptional 11.8% |
| Ugandans | 93.1 /100 | #124 | Exceptional 11.8% |
| Ukrainians | 92.3 /100 | #125 | Exceptional 11.8% |
| South American Indians | 92.1 /100 | #126 | Exceptional 11.8% |
| South Africans | 88.9 /100 | #127 | Excellent 11.8% |