Hungarian vs Northern European Divorced or Separated

COMPARE

Hungarian
Race
Ancestry
AfghanAfricanAlaska NativeAlaskan AthabascanAlbanianAleutAlsatianAmericanApacheArabArapahoArgentineanArmenianAssyrian/Chaldean/SyriacAustralianAustrianBahamianBangladeshiBarbadianBasqueBelgianBelizeanBermudanBhutaneseBlackfeetBolivianBrazilianBritishBritish West IndianBulgarianBurmeseCajunCambodianCanadianCape VerdeanCarpatho RusynCelticCentral AmericanCentral American IndianCherokeeCheyenneChickasawChileanChineseChippewaChoctawColombianColvilleComancheCosta RicanCreeCreekCroatianCrowCubanCypriotCzechCzechoslovakianDanishDelawareDominicanDutchDutch West IndianEastern EuropeanEcuadorianEgyptianEnglishEstonianEthiopianEuropeanFijianFilipinoFinnishFrenchFrench American IndianFrench CanadianGermanGerman RussianGhanaianGreekGuamanian/ChamorroGuatemalanGuyaneseHaitianHmongHonduranHopiHoumaHungarianIcelanderIndian (Asian)IndonesianInupiatIranianIraqiIrishIroquoisIsraeliItalianJamaicanJapaneseJordanianKenyanKiowaKoreanLaotianLatvianLebaneseLiberianLithuanianLumbeeLuxembourgerMacedonianMalaysianMalteseMarshalleseMenomineeMexicanMexican American IndianMongolianMoroccanNative HawaiianNavajoNepaleseNew ZealanderNicaraguanNigerianNorwegianOkinawanOsageOttawaPaiutePakistaniPalestinianPanamanianParaguayanPennsylvania GermanPeruvianPimaPolishPortuguesePotawatomiPuebloPuerto RicanPuget Sound SalishRomanianRussianSalvadoranSamoanScandinavianScotch-IrishScottishSeminoleSenegaleseSerbianShoshoneSierra LeoneanSiouxSlavicSlovakSloveneSomaliSouth AfricanSouth AmericanSouth American IndianSoviet UnionSpaniardSpanishSpanish AmericanSpanish American IndianSri LankanSubsaharan AfricanSudaneseSwedishSwissSyrianTaiwaneseThaiTlingit-HaidaTohono O'OdhamTonganTrinidadian and TobagonianTsimshianTurkishU.S. Virgin IslanderUgandanUkrainianUruguayanUteVenezuelanVietnameseWelshWest IndianYakamaYaquiYugoslavianYumanYup'ikZimbabwean
Immigration
NonimmigrantsImmigrantsAfghanistanAfricaAlbaniaArgentinaArmeniaAsiaAustraliaAustriaBahamasBangladeshBarbadosBelarusBelgiumBelizeBoliviaBosnia and HerzegovinaBrazilBulgariaBurma/MyanmarCabo VerdeCambodiaCameroonCanadaCaribbeanCentral AmericaChileChinaColombiaCongoCosta RicaCroatiaCubaCzechoslovakiaDenmarkDominicaDominican RepublicEastern AfricaEastern AsiaEastern EuropeEcuadorEgyptEl SalvadorEnglandEritreaEthiopiaEuropeFijiFranceGermanyGhanaGreeceGrenadaGuatemalaGuyanaHaitiHondurasHong KongHungaryIndiaIndonesiaIranIraqIrelandIsraelItalyJamaicaJapanJordanKazakhstanKenyaKoreaKuwaitLaosLatin AmericaLatviaLebanonLiberiaLithuaniaMalaysiaMexicoMicronesiaMiddle AfricaMoldovaMoroccoNepalNetherlandsNicaraguaNigeriaNorth AmericaNorth MacedoniaNorthern AfricaNorthern EuropeNorwayOceaniaPakistanPanamaPeruPhilippinesPolandPortugalRomaniaRussiaSaudi ArabiaScotlandSenegalSerbiaSierra LeoneSingaporeSomaliaSouth AfricaSouth AmericaSouth Central AsiaSouth Eastern AsiaSouthern EuropeSpainSri LankaSt. Vincent and the GrenadinesSudanSwedenSwitzerlandSyriaTaiwanThailandTrinidad and TobagoTurkeyUgandaUkraineUruguayUzbekistanVenezuelaVietnamWest IndiesWestern AfricaWestern AsiaWestern EuropeYemenZaireZimbabweAzores
Northern European
Race
Ancestry
AfghanAfricanAlaska NativeAlaskan AthabascanAlbanianAleutAlsatianAmericanApacheArabArapahoArgentineanArmenianAssyrian/Chaldean/SyriacAustralianAustrianBahamianBangladeshiBarbadianBasqueBelgianBelizeanBermudanBhutaneseBlackfeetBolivianBrazilianBritishBritish West IndianBulgarianBurmeseCajunCambodianCanadianCape VerdeanCarpatho RusynCelticCentral AmericanCentral American IndianCherokeeCheyenneChickasawChileanChineseChippewaChoctawColombianColvilleComancheCosta RicanCreeCreekCroatianCrowCubanCypriotCzechCzechoslovakianDanishDelawareDominicanDutchDutch West IndianEastern EuropeanEcuadorianEgyptianEnglishEstonianEthiopianEuropeanFijianFilipinoFinnishFrenchFrench American IndianFrench CanadianGermanGerman RussianGhanaianGreekGuamanian/ChamorroGuatemalanGuyaneseHaitianHmongHonduranHopiHoumaIcelanderIndian (Asian)IndonesianInupiatIranianIraqiIrishIroquoisIsraeliItalianJamaicanJapaneseJordanianKenyanKiowaKoreanLaotianLatvianLebaneseLiberianLithuanianLumbeeLuxembourgerMacedonianMalaysianMalteseMarshalleseMenomineeMexicanMexican American IndianMongolianMoroccanNative HawaiianNavajoNepaleseNew ZealanderNicaraguanNigerianNorthern EuropeanNorwegianOkinawanOsageOttawaPaiutePakistaniPalestinianPanamanianParaguayanPennsylvania GermanPeruvianPimaPolishPortuguesePotawatomiPuebloPuerto RicanPuget Sound SalishRomanianRussianSalvadoranSamoanScandinavianScotch-IrishScottishSeminoleSenegaleseSerbianShoshoneSierra LeoneanSiouxSlavicSlovakSloveneSomaliSouth AfricanSouth AmericanSouth American IndianSoviet UnionSpaniardSpanishSpanish AmericanSpanish American IndianSri LankanSubsaharan AfricanSudaneseSwedishSwissSyrianTaiwaneseThaiTlingit-HaidaTohono O'OdhamTonganTrinidadian and TobagonianTsimshianTurkishU.S. Virgin IslanderUgandanUkrainianUruguayanUteVenezuelanVietnameseWelshWest IndianYakamaYaquiYugoslavianYumanYup'ikZimbabwean
Immigration
NonimmigrantsImmigrantsAfghanistanAfricaAlbaniaArgentinaArmeniaAsiaAustraliaAustriaBahamasBangladeshBarbadosBelarusBelgiumBelizeBoliviaBosnia and HerzegovinaBrazilBulgariaBurma/MyanmarCabo VerdeCambodiaCameroonCanadaCaribbeanCentral AmericaChileChinaColombiaCongoCosta RicaCroatiaCubaCzechoslovakiaDenmarkDominicaDominican RepublicEastern AfricaEastern AsiaEastern EuropeEcuadorEgyptEl SalvadorEnglandEritreaEthiopiaEuropeFijiFranceGermanyGhanaGreeceGrenadaGuatemalaGuyanaHaitiHondurasHong KongHungaryIndiaIndonesiaIranIraqIrelandIsraelItalyJamaicaJapanJordanKazakhstanKenyaKoreaKuwaitLaosLatin AmericaLatviaLebanonLiberiaLithuaniaMalaysiaMexicoMicronesiaMiddle AfricaMoldovaMoroccoNepalNetherlandsNicaraguaNigeriaNorth AmericaNorth MacedoniaNorthern AfricaNorthern EuropeNorwayOceaniaPakistanPanamaPeruPhilippinesPolandPortugalRomaniaRussiaSaudi ArabiaScotlandSenegalSerbiaSierra LeoneSingaporeSomaliaSouth AfricaSouth AmericaSouth Central AsiaSouth Eastern AsiaSouthern EuropeSpainSri LankaSt. Vincent and the GrenadinesSudanSwedenSwitzerlandSyriaTaiwanThailandTrinidad and TobagoTurkeyUgandaUkraineUruguayUzbekistanVenezuelaVietnamWest IndiesWestern AfricaWestern AsiaWestern EuropeYemenZaireZimbabweAzores
Divorced or Separated
Income
Poverty
Unemployment
Labor Participation
Family Structure
Vehicle Availability
Education Level
Disability

Divorced or Separated Comparison

Hungarians

Northern Europeans

Good
Poor
12.0%
DIVORCED OR SEPARATED
70.3/ 100
METRIC RATING
156th/ 347
METRIC RANK
12.2%
DIVORCED OR SEPARATED
14.7/ 100
METRIC RATING
217th/ 347
METRIC RANK

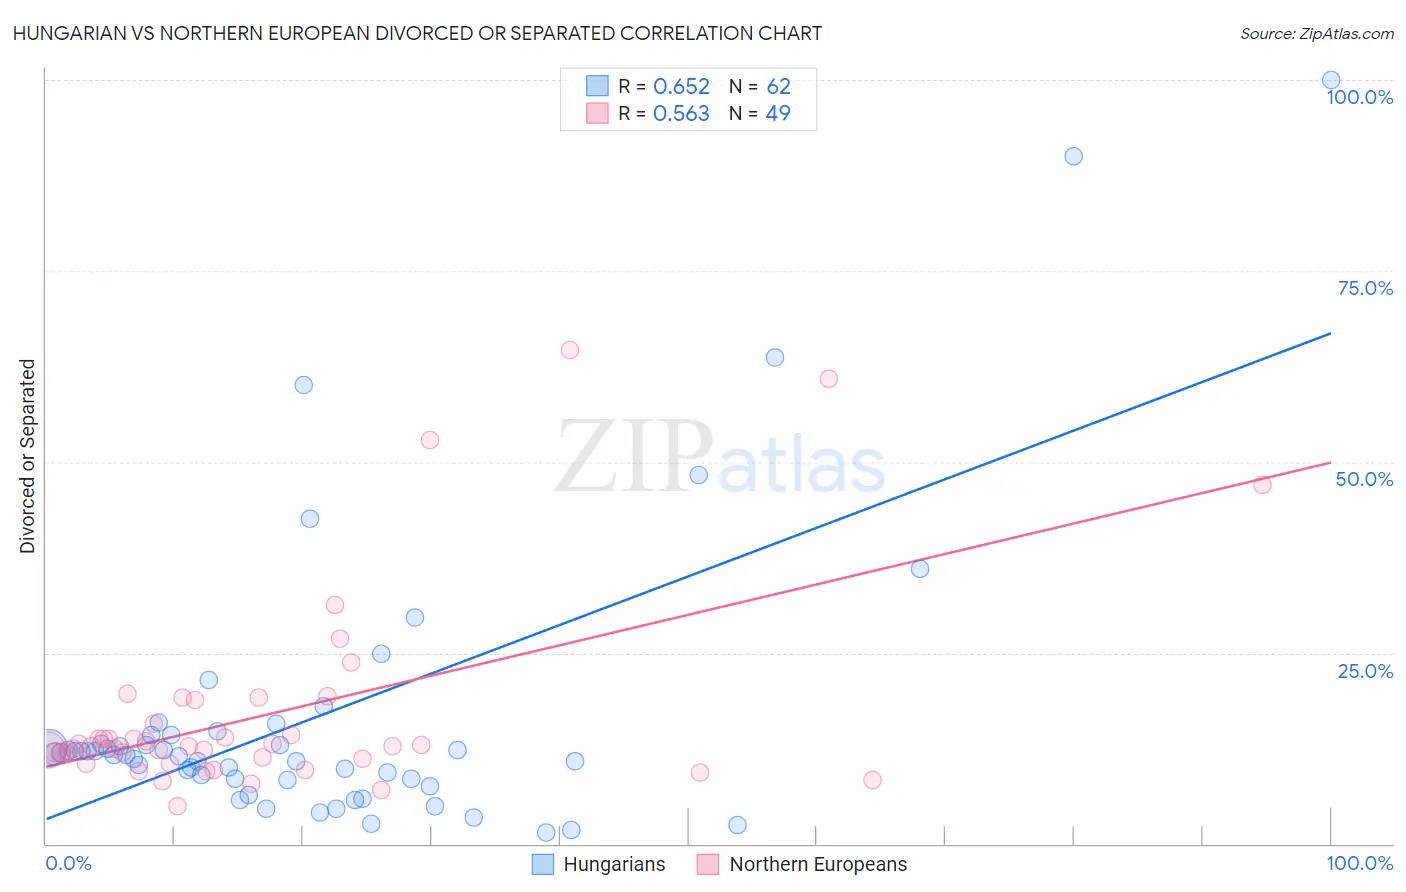
Hungarian vs Northern European Divorced or Separated Correlation Chart

The statistical analysis conducted on geographies consisting of 485,998,803 people shows a significant positive correlation between the proportion of Hungarians and percentage of population currently divorced or separated in the United States with a correlation coefficient (R) of 0.652 and weighted average of 12.0%. Similarly, the statistical analysis conducted on geographies consisting of 405,985,696 people shows a substantial positive correlation between the proportion of Northern Europeans and percentage of population currently divorced or separated in the United States with a correlation coefficient (R) of 0.563 and weighted average of 12.2%, a difference of 2.3%.
Hungarian vs Northern European Divorced or Separated

Divorced or Separated Correlation Summary

MeasurementHungarianNorthern European
Minimum1.4%4.9%
Maximum100.0%64.7%
Range98.6%59.8%
Mean16.6%16.9%
Median11.7%12.8%
Interquartile 25% (IQ1)8.5%10.8%
Interquartile 75% (IQ3)14.2%17.2%
Interquartile Range (IQR)5.8%6.4%
Standard Deviation (Sample)19.0%12.9%
Standard Deviation (Population)18.8%12.8%

Similar Demographics by Divorced or Separated

Demographics Similar to Hungarians by Divorced or Separated

In terms of divorced or separated, the demographic groups most similar to Hungarians are Japanese (12.0%, a difference of 0.020%), Chilean (12.0%, a difference of 0.040%), Immigrants from Brazil (12.0%, a difference of 0.060%), Austrian (12.0%, a difference of 0.080%), and Immigrants from Hungary (11.9%, a difference of 0.15%).
DemographicsRating | RankDivorced or Separated
Immigrants | Oceania
77.7
/100
|
#149
Good
11.9%
Immigrants | Portugal
77.3
/100
|
#150
Good
11.9%
Czechs
76.4
/100
|
#151
Good
11.9%
Immigrants | Hungary
73.7
/100
|
#152
Good
11.9%
Austrians
72.2
/100
|
#153
Good
12.0%
Chileans
71.3
/100
|
#154
Good
12.0%
Japanese
70.9
/100
|
#155
Good
12.0%
Hungarians
70.3
/100
|
#156
Good
12.0%
Immigrants | Brazil
68.8
/100
|
#157
Good
12.0%
Icelanders
66.0
/100
|
#158
Good
12.0%
Immigrants | Barbados
66.0
/100
|
#159
Good
12.0%
Immigrants | Scotland
65.8
/100
|
#160
Good
12.0%
Marshallese
64.6
/100
|
#161
Good
12.0%
Samoans
64.3
/100
|
#162
Good
12.0%
Navajo
63.9
/100
|
#163
Good
12.0%

Demographics Similar to Northern Europeans by Divorced or Separated

In terms of divorced or separated, the demographic groups most similar to Northern Europeans are Immigrants from South America (12.2%, a difference of 0.040%), Immigrants from Argentina (12.2%, a difference of 0.050%), European (12.2%, a difference of 0.050%), Immigrants from Eastern Africa (12.2%, a difference of 0.10%), and Slovene (12.3%, a difference of 0.11%).
DemographicsRating | RankDivorced or Separated
Slavs
17.0
/100
|
#210
Poor
12.2%
Trinidadians and Tobagonians
16.6
/100
|
#211
Poor
12.2%
Immigrants | Kenya
16.5
/100
|
#212
Poor
12.2%
Immigrants | Eastern Africa
16.2
/100
|
#213
Poor
12.2%
Immigrants | Argentina
15.5
/100
|
#214
Poor
12.2%
Europeans
15.4
/100
|
#215
Poor
12.2%
Immigrants | South America
15.4
/100
|
#216
Poor
12.2%
Northern Europeans
14.7
/100
|
#217
Poor
12.2%
Slovenes
13.2
/100
|
#218
Poor
12.3%
Czechoslovakians
11.7
/100
|
#219
Poor
12.3%
British
11.6
/100
|
#220
Poor
12.3%
Guamanians/Chamorros
11.3
/100
|
#221
Poor
12.3%
Bangladeshis
10.5
/100
|
#222
Poor
12.3%
Scandinavians
10.4
/100
|
#223
Poor
12.3%
Immigrants | Azores
9.7
/100
|
#224
Tragic
12.3%