Hungarian vs Immigrants from Jordan Divorced or Separated
COMPARE
Hungarian
Immigrants from Jordan
Divorced or Separated
Divorced or Separated Comparison
Hungarians
Immigrants from Jordan
12.0%
DIVORCED OR SEPARATED
70.3/ 100
METRIC RATING
156th/ 347
METRIC RANK
11.6%
DIVORCED OR SEPARATED
98.6/ 100
METRIC RATING
98th/ 347
METRIC RANK
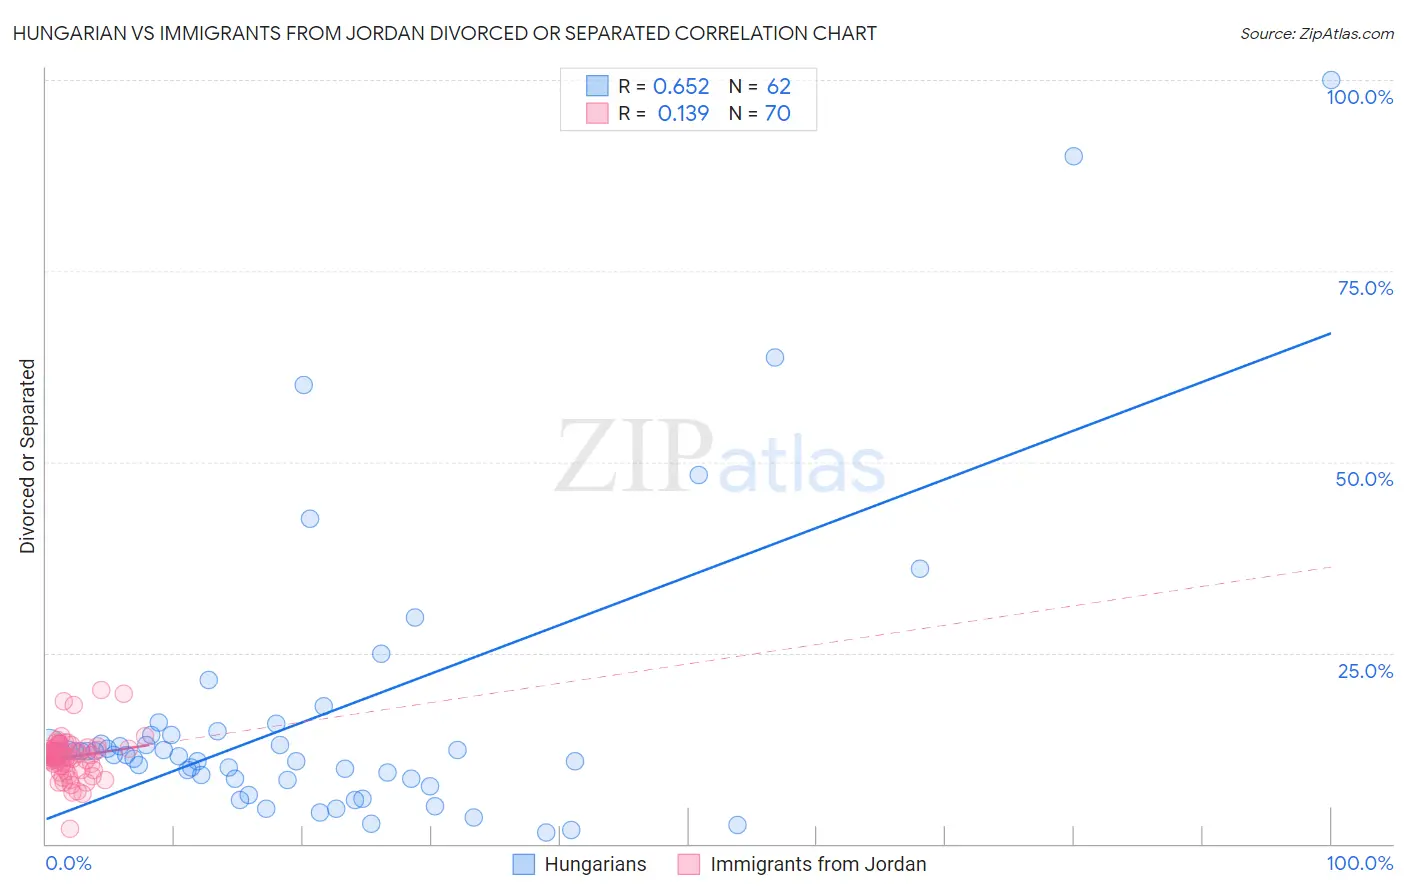
Hungarian vs Immigrants from Jordan Divorced or Separated Correlation Chart
The statistical analysis conducted on geographies consisting of 485,998,803 people shows a significant positive correlation between the proportion of Hungarians and percentage of population currently divorced or separated in the United States with a correlation coefficient (R) of 0.652 and weighted average of 12.0%. Similarly, the statistical analysis conducted on geographies consisting of 181,255,451 people shows a poor positive correlation between the proportion of Immigrants from Jordan and percentage of population currently divorced or separated in the United States with a correlation coefficient (R) of 0.139 and weighted average of 11.6%, a difference of 3.1%.
Divorced or Separated Correlation Summary
| Measurement | Hungarian | Immigrants from Jordan |
| Minimum | 1.4% | 1.9% |
| Maximum | 100.0% | 20.2% |
| Range | 98.6% | 18.3% |
| Mean | 16.6% | 11.3% |
| Median | 11.7% | 11.4% |
| Interquartile 25% (IQ1) | 8.5% | 10.1% |
| Interquartile 75% (IQ3) | 14.2% | 12.5% |
| Interquartile Range (IQR) | 5.8% | 2.4% |
| Standard Deviation (Sample) | 19.0% | 2.9% |
| Standard Deviation (Population) | 18.8% | 2.8% |
Similar Demographics by Divorced or Separated
Demographics Similar to Hungarians by Divorced or Separated
In terms of divorced or separated, the demographic groups most similar to Hungarians are Japanese (12.0%, a difference of 0.020%), Chilean (12.0%, a difference of 0.040%), Immigrants from Brazil (12.0%, a difference of 0.060%), Austrian (12.0%, a difference of 0.080%), and Immigrants from Hungary (11.9%, a difference of 0.15%).
| Demographics | Rating | Rank | Divorced or Separated |
| Immigrants | Oceania | 77.7 /100 | #149 | Good 11.9% |
| Immigrants | Portugal | 77.3 /100 | #150 | Good 11.9% |
| Czechs | 76.4 /100 | #151 | Good 11.9% |
| Immigrants | Hungary | 73.7 /100 | #152 | Good 11.9% |
| Austrians | 72.2 /100 | #153 | Good 12.0% |
| Chileans | 71.3 /100 | #154 | Good 12.0% |
| Japanese | 70.9 /100 | #155 | Good 12.0% |
| Hungarians | 70.3 /100 | #156 | Good 12.0% |
| Immigrants | Brazil | 68.8 /100 | #157 | Good 12.0% |
| Icelanders | 66.0 /100 | #158 | Good 12.0% |
| Immigrants | Barbados | 66.0 /100 | #159 | Good 12.0% |
| Immigrants | Scotland | 65.8 /100 | #160 | Good 12.0% |
| Marshallese | 64.6 /100 | #161 | Good 12.0% |
| Samoans | 64.3 /100 | #162 | Good 12.0% |
| Navajo | 63.9 /100 | #163 | Good 12.0% |
Demographics Similar to Immigrants from Jordan by Divorced or Separated
In terms of divorced or separated, the demographic groups most similar to Immigrants from Jordan are Immigrants from Sweden (11.6%, a difference of 0.020%), Latvian (11.6%, a difference of 0.040%), Immigrants from Northern Europe (11.6%, a difference of 0.050%), Immigrants from Ukraine (11.6%, a difference of 0.060%), and Immigrants from Guyana (11.6%, a difference of 0.080%).
| Demographics | Rating | Rank | Divorced or Separated |
| Spanish American Indians | 99.0 /100 | #91 | Exceptional 11.6% |
| Immigrants | Denmark | 98.9 /100 | #92 | Exceptional 11.6% |
| Arabs | 98.9 /100 | #93 | Exceptional 11.6% |
| Immigrants | Fiji | 98.9 /100 | #94 | Exceptional 11.6% |
| Immigrants | Serbia | 98.8 /100 | #95 | Exceptional 11.6% |
| Immigrants | Ukraine | 98.7 /100 | #96 | Exceptional 11.6% |
| Latvians | 98.7 /100 | #97 | Exceptional 11.6% |
| Immigrants | Jordan | 98.6 /100 | #98 | Exceptional 11.6% |
| Immigrants | Sweden | 98.6 /100 | #99 | Exceptional 11.6% |
| Immigrants | Northern Europe | 98.6 /100 | #100 | Exceptional 11.6% |
| Immigrants | Guyana | 98.5 /100 | #101 | Exceptional 11.6% |
| Immigrants | Croatia | 98.3 /100 | #102 | Exceptional 11.6% |
| Maltese | 98.2 /100 | #103 | Exceptional 11.6% |
| Salvadorans | 98.2 /100 | #104 | Exceptional 11.6% |
| Immigrants | El Salvador | 97.9 /100 | #105 | Exceptional 11.7% |