Cheyenne vs Iraqi Divorced or Separated
COMPARE
Cheyenne
Iraqi
Divorced or Separated
Divorced or Separated Comparison
Cheyenne
Iraqis
13.4%
DIVORCED OR SEPARATED
0.0/ 100
METRIC RATING
321st/ 347
METRIC RANK
11.8%
DIVORCED OR SEPARATED
94.6/ 100
METRIC RATING
120th/ 347
METRIC RANK
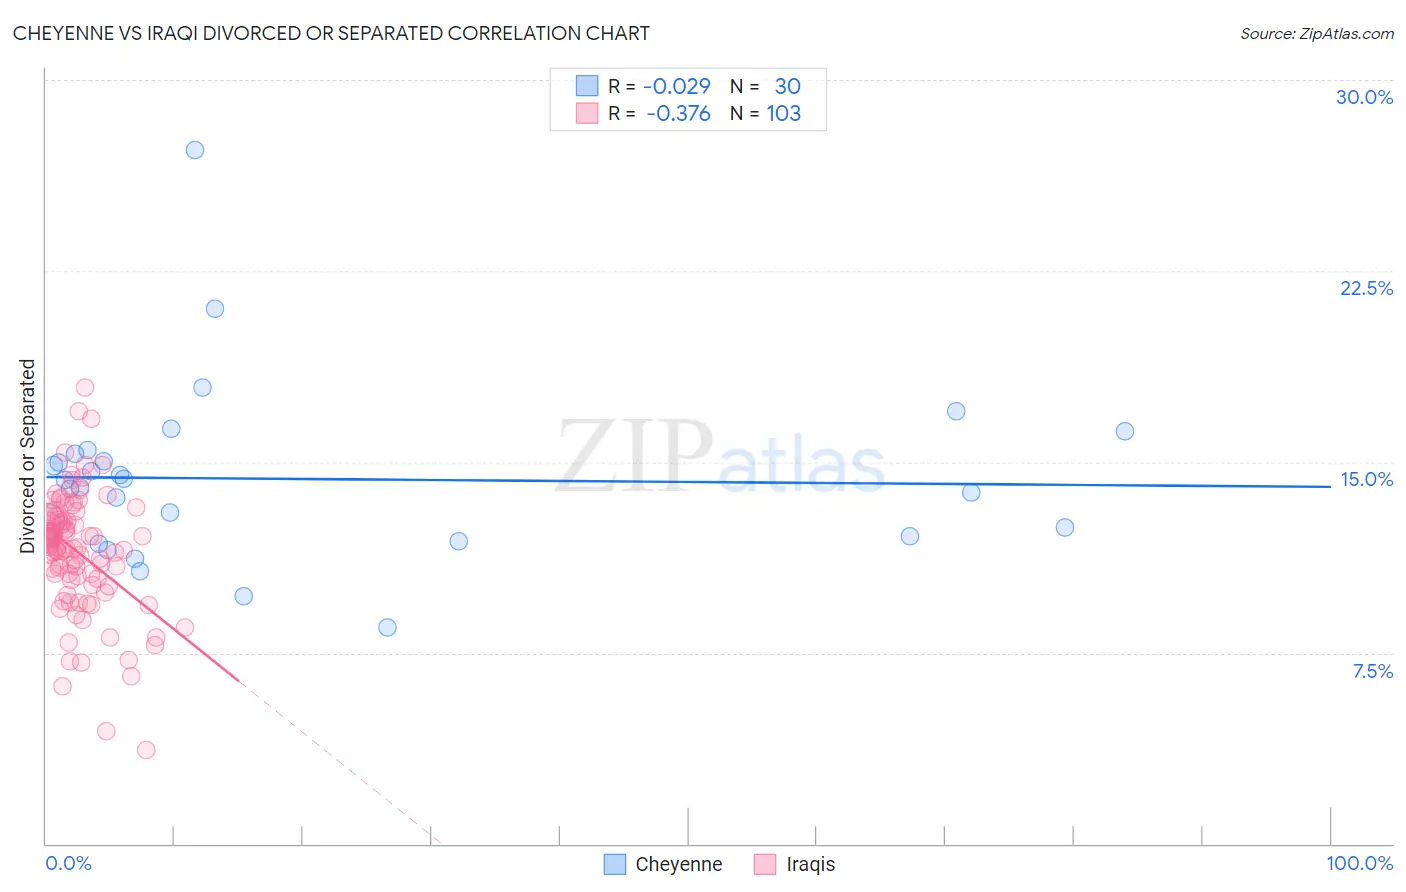
Cheyenne vs Iraqi Divorced or Separated Correlation Chart
The statistical analysis conducted on geographies consisting of 80,717,753 people shows no correlation between the proportion of Cheyenne and percentage of population currently divorced or separated in the United States with a correlation coefficient (R) of -0.029 and weighted average of 13.4%. Similarly, the statistical analysis conducted on geographies consisting of 170,608,468 people shows a mild negative correlation between the proportion of Iraqis and percentage of population currently divorced or separated in the United States with a correlation coefficient (R) of -0.376 and weighted average of 11.8%, a difference of 13.8%.
Divorced or Separated Correlation Summary
| Measurement | Cheyenne | Iraqi |
| Minimum | 8.5% | 3.7% |
| Maximum | 27.2% | 17.9% |
| Range | 18.7% | 14.2% |
| Mean | 14.3% | 11.4% |
| Median | 14.1% | 11.7% |
| Interquartile 25% (IQ1) | 12.1% | 10.4% |
| Interquartile 75% (IQ3) | 15.3% | 12.7% |
| Interquartile Range (IQR) | 3.2% | 2.4% |
| Standard Deviation (Sample) | 3.5% | 2.4% |
| Standard Deviation (Population) | 3.4% | 2.4% |
Similar Demographics by Divorced or Separated
Demographics Similar to Cheyenne by Divorced or Separated
In terms of divorced or separated, the demographic groups most similar to Cheyenne are Cajun (13.4%, a difference of 0.10%), Puget Sound Salish (13.4%, a difference of 0.16%), Cree (13.4%, a difference of 0.20%), Haitian (13.3%, a difference of 0.22%), and Tsimshian (13.3%, a difference of 0.24%).
| Demographics | Rating | Rank | Divorced or Separated |
| Yaqui | 0.0 /100 | #314 | Tragic 13.3% |
| Spanish Americans | 0.0 /100 | #315 | Tragic 13.3% |
| Tsimshian | 0.0 /100 | #316 | Tragic 13.3% |
| Haitians | 0.0 /100 | #317 | Tragic 13.3% |
| Cree | 0.0 /100 | #318 | Tragic 13.4% |
| Puget Sound Salish | 0.0 /100 | #319 | Tragic 13.4% |
| Cajuns | 0.0 /100 | #320 | Tragic 13.4% |
| Cheyenne | 0.0 /100 | #321 | Tragic 13.4% |
| Immigrants | Haiti | 0.0 /100 | #322 | Tragic 13.4% |
| U.S. Virgin Islanders | 0.0 /100 | #323 | Tragic 13.4% |
| Osage | 0.0 /100 | #324 | Tragic 13.4% |
| Potawatomi | 0.0 /100 | #325 | Tragic 13.5% |
| Immigrants | Congo | 0.0 /100 | #326 | Tragic 13.5% |
| Comanche | 0.0 /100 | #327 | Tragic 13.5% |
| Immigrants | Caribbean | 0.0 /100 | #328 | Tragic 13.6% |
Demographics Similar to Iraqis by Divorced or Separated
In terms of divorced or separated, the demographic groups most similar to Iraqis are Romanian (11.8%, a difference of 0.010%), Syrian (11.7%, a difference of 0.090%), Immigrants from Uganda (11.7%, a difference of 0.13%), Ecuadorian (11.7%, a difference of 0.13%), and Menominee (11.8%, a difference of 0.13%).
| Demographics | Rating | Rank | Divorced or Separated |
| Estonians | 96.6 /100 | #113 | Exceptional 11.7% |
| Immigrants | Norway | 95.9 /100 | #114 | Exceptional 11.7% |
| Lithuanians | 95.7 /100 | #115 | Exceptional 11.7% |
| Immigrants | Iraq | 95.4 /100 | #116 | Exceptional 11.7% |
| Immigrants | Uganda | 95.3 /100 | #117 | Exceptional 11.7% |
| Ecuadorians | 95.3 /100 | #118 | Exceptional 11.7% |
| Syrians | 95.1 /100 | #119 | Exceptional 11.7% |
| Iraqis | 94.6 /100 | #120 | Exceptional 11.8% |
| Romanians | 94.5 /100 | #121 | Exceptional 11.8% |
| Menominee | 93.8 /100 | #122 | Exceptional 11.8% |
| Immigrants | Immigrants | 93.7 /100 | #123 | Exceptional 11.8% |
| Ugandans | 93.1 /100 | #124 | Exceptional 11.8% |
| Ukrainians | 92.3 /100 | #125 | Exceptional 11.8% |
| South American Indians | 92.1 /100 | #126 | Exceptional 11.8% |
| South Africans | 88.9 /100 | #127 | Excellent 11.8% |