Hungarian vs Immigrants from Western Europe Divorced or Separated
COMPARE
Hungarian
Immigrants from Western Europe
Divorced or Separated
Divorced or Separated Comparison
Hungarians
Immigrants from Western Europe
12.0%
DIVORCED OR SEPARATED
70.3/ 100
METRIC RATING
156th/ 347
METRIC RANK
12.1%
DIVORCED OR SEPARATED
45.6/ 100
METRIC RATING
179th/ 347
METRIC RANK
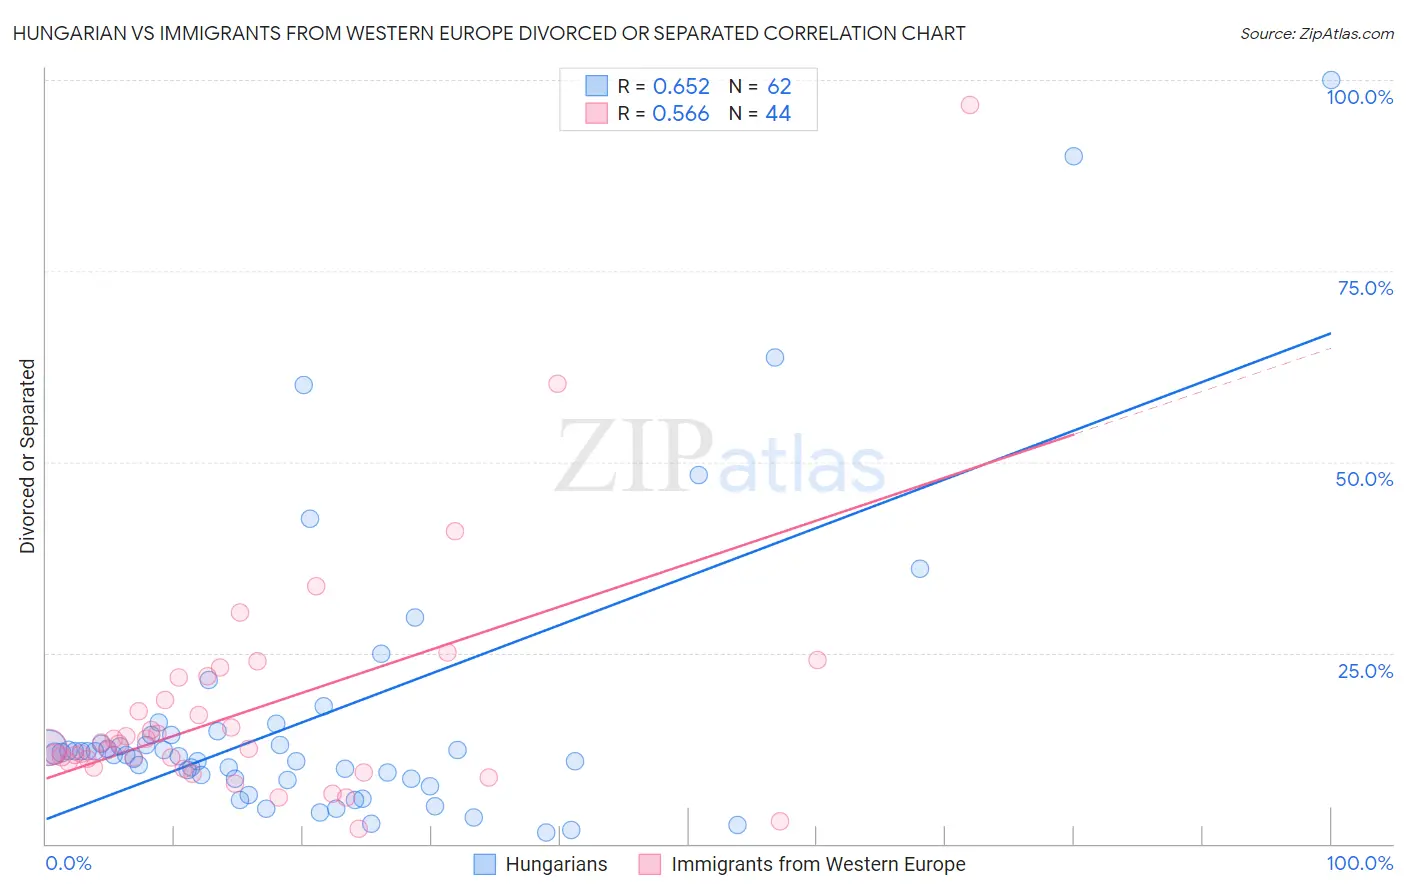
Hungarian vs Immigrants from Western Europe Divorced or Separated Correlation Chart
The statistical analysis conducted on geographies consisting of 485,998,803 people shows a significant positive correlation between the proportion of Hungarians and percentage of population currently divorced or separated in the United States with a correlation coefficient (R) of 0.652 and weighted average of 12.0%. Similarly, the statistical analysis conducted on geographies consisting of 493,891,815 people shows a substantial positive correlation between the proportion of Immigrants from Western Europe and percentage of population currently divorced or separated in the United States with a correlation coefficient (R) of 0.566 and weighted average of 12.1%, a difference of 0.91%.
Divorced or Separated Correlation Summary
| Measurement | Hungarian | Immigrants from Western Europe |
| Minimum | 1.4% | 1.9% |
| Maximum | 100.0% | 96.8% |
| Range | 98.6% | 94.9% |
| Mean | 16.6% | 17.6% |
| Median | 11.7% | 12.9% |
| Interquartile 25% (IQ1) | 8.5% | 10.3% |
| Interquartile 75% (IQ3) | 14.2% | 20.3% |
| Interquartile Range (IQR) | 5.8% | 9.9% |
| Standard Deviation (Sample) | 19.0% | 16.0% |
| Standard Deviation (Population) | 18.8% | 15.8% |
Similar Demographics by Divorced or Separated
Demographics Similar to Hungarians by Divorced or Separated
In terms of divorced or separated, the demographic groups most similar to Hungarians are Japanese (12.0%, a difference of 0.020%), Chilean (12.0%, a difference of 0.040%), Immigrants from Brazil (12.0%, a difference of 0.060%), Austrian (12.0%, a difference of 0.080%), and Immigrants from Hungary (11.9%, a difference of 0.15%).
| Demographics | Rating | Rank | Divorced or Separated |
| Immigrants | Oceania | 77.7 /100 | #149 | Good 11.9% |
| Immigrants | Portugal | 77.3 /100 | #150 | Good 11.9% |
| Czechs | 76.4 /100 | #151 | Good 11.9% |
| Immigrants | Hungary | 73.7 /100 | #152 | Good 11.9% |
| Austrians | 72.2 /100 | #153 | Good 12.0% |
| Chileans | 71.3 /100 | #154 | Good 12.0% |
| Japanese | 70.9 /100 | #155 | Good 12.0% |
| Hungarians | 70.3 /100 | #156 | Good 12.0% |
| Immigrants | Brazil | 68.8 /100 | #157 | Good 12.0% |
| Icelanders | 66.0 /100 | #158 | Good 12.0% |
| Immigrants | Barbados | 66.0 /100 | #159 | Good 12.0% |
| Immigrants | Scotland | 65.8 /100 | #160 | Good 12.0% |
| Marshallese | 64.6 /100 | #161 | Good 12.0% |
| Samoans | 64.3 /100 | #162 | Good 12.0% |
| Navajo | 63.9 /100 | #163 | Good 12.0% |
Demographics Similar to Immigrants from Western Europe by Divorced or Separated
In terms of divorced or separated, the demographic groups most similar to Immigrants from Western Europe are Ghanaian (12.1%, a difference of 0.010%), Barbadian (12.1%, a difference of 0.020%), Immigrants from Canada (12.1%, a difference of 0.050%), Brazilian (12.1%, a difference of 0.080%), and Immigrants from Ethiopia (12.1%, a difference of 0.090%).
| Demographics | Rating | Rank | Divorced or Separated |
| Immigrants | Mexico | 53.2 /100 | #172 | Average 12.0% |
| Immigrants | Moldova | 50.4 /100 | #173 | Average 12.1% |
| Hawaiians | 50.0 /100 | #174 | Average 12.1% |
| Immigrants | Sierra Leone | 50.0 /100 | #175 | Average 12.1% |
| Pennsylvania Germans | 48.9 /100 | #176 | Average 12.1% |
| Brazilians | 47.7 /100 | #177 | Average 12.1% |
| Ghanaians | 45.9 /100 | #178 | Average 12.1% |
| Immigrants | Western Europe | 45.6 /100 | #179 | Average 12.1% |
| Barbadians | 45.0 /100 | #180 | Average 12.1% |
| Immigrants | Canada | 44.0 /100 | #181 | Average 12.1% |
| Immigrants | Ethiopia | 43.1 /100 | #182 | Average 12.1% |
| Immigrants | Central America | 42.9 /100 | #183 | Average 12.1% |
| Immigrants | North America | 41.1 /100 | #184 | Average 12.1% |
| Immigrants | Nigeria | 40.5 /100 | #185 | Average 12.1% |
| Immigrants | Chile | 39.0 /100 | #186 | Fair 12.1% |