Hungarian vs Immigrants from Malaysia Divorced or Separated
COMPARE
Hungarian
Immigrants from Malaysia
Divorced or Separated
Divorced or Separated Comparison
Hungarians
Immigrants from Malaysia
12.0%
DIVORCED OR SEPARATED
70.3/ 100
METRIC RATING
156th/ 347
METRIC RANK
11.0%
DIVORCED OR SEPARATED
100.0/ 100
METRIC RATING
28th/ 347
METRIC RANK
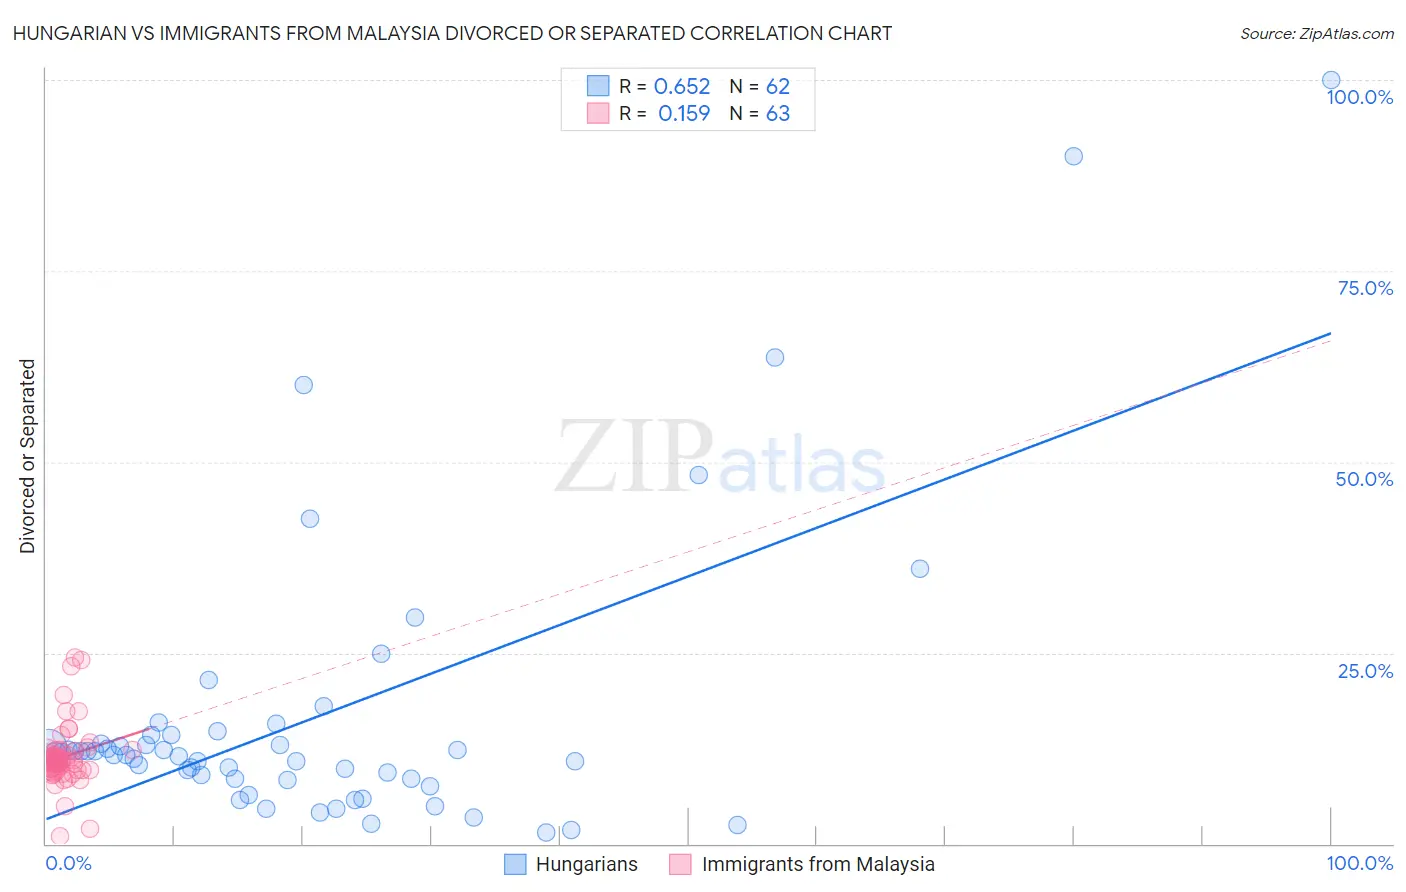
Hungarian vs Immigrants from Malaysia Divorced or Separated Correlation Chart
The statistical analysis conducted on geographies consisting of 485,998,803 people shows a significant positive correlation between the proportion of Hungarians and percentage of population currently divorced or separated in the United States with a correlation coefficient (R) of 0.652 and weighted average of 12.0%. Similarly, the statistical analysis conducted on geographies consisting of 197,936,479 people shows a poor positive correlation between the proportion of Immigrants from Malaysia and percentage of population currently divorced or separated in the United States with a correlation coefficient (R) of 0.159 and weighted average of 11.0%, a difference of 9.1%.
Divorced or Separated Correlation Summary
| Measurement | Hungarian | Immigrants from Malaysia |
| Minimum | 1.4% | 1.0% |
| Maximum | 100.0% | 24.4% |
| Range | 98.6% | 23.4% |
| Mean | 16.6% | 11.4% |
| Median | 11.7% | 10.8% |
| Interquartile 25% (IQ1) | 8.5% | 9.6% |
| Interquartile 75% (IQ3) | 14.2% | 12.1% |
| Interquartile Range (IQR) | 5.8% | 2.5% |
| Standard Deviation (Sample) | 19.0% | 4.0% |
| Standard Deviation (Population) | 18.8% | 4.0% |
Similar Demographics by Divorced or Separated
Demographics Similar to Hungarians by Divorced or Separated
In terms of divorced or separated, the demographic groups most similar to Hungarians are Japanese (12.0%, a difference of 0.020%), Chilean (12.0%, a difference of 0.040%), Immigrants from Brazil (12.0%, a difference of 0.060%), Austrian (12.0%, a difference of 0.080%), and Immigrants from Hungary (11.9%, a difference of 0.15%).
| Demographics | Rating | Rank | Divorced or Separated |
| Immigrants | Oceania | 77.7 /100 | #149 | Good 11.9% |
| Immigrants | Portugal | 77.3 /100 | #150 | Good 11.9% |
| Czechs | 76.4 /100 | #151 | Good 11.9% |
| Immigrants | Hungary | 73.7 /100 | #152 | Good 11.9% |
| Austrians | 72.2 /100 | #153 | Good 12.0% |
| Chileans | 71.3 /100 | #154 | Good 12.0% |
| Japanese | 70.9 /100 | #155 | Good 12.0% |
| Hungarians | 70.3 /100 | #156 | Good 12.0% |
| Immigrants | Brazil | 68.8 /100 | #157 | Good 12.0% |
| Icelanders | 66.0 /100 | #158 | Good 12.0% |
| Immigrants | Barbados | 66.0 /100 | #159 | Good 12.0% |
| Immigrants | Scotland | 65.8 /100 | #160 | Good 12.0% |
| Marshallese | 64.6 /100 | #161 | Good 12.0% |
| Samoans | 64.3 /100 | #162 | Good 12.0% |
| Navajo | 63.9 /100 | #163 | Good 12.0% |
Demographics Similar to Immigrants from Malaysia by Divorced or Separated
In terms of divorced or separated, the demographic groups most similar to Immigrants from Malaysia are Immigrants from Bangladesh (11.0%, a difference of 0.030%), Armenian (11.0%, a difference of 0.070%), Immigrants from Indonesia (10.9%, a difference of 0.47%), Immigrants from Ireland (11.0%, a difference of 0.59%), and Mongolian (11.1%, a difference of 0.89%).
| Demographics | Rating | Rank | Divorced or Separated |
| Immigrants | Asia | 100.0 /100 | #21 | Exceptional 10.7% |
| Vietnamese | 100.0 /100 | #22 | Exceptional 10.8% |
| Immigrants | Pakistan | 100.0 /100 | #23 | Exceptional 10.8% |
| Immigrants | Sri Lanka | 100.0 /100 | #24 | Exceptional 10.8% |
| Iranians | 100.0 /100 | #25 | Exceptional 10.8% |
| Immigrants | Indonesia | 100.0 /100 | #26 | Exceptional 10.9% |
| Immigrants | Bangladesh | 100.0 /100 | #27 | Exceptional 11.0% |
| Immigrants | Malaysia | 100.0 /100 | #28 | Exceptional 11.0% |
| Armenians | 100.0 /100 | #29 | Exceptional 11.0% |
| Immigrants | Ireland | 100.0 /100 | #30 | Exceptional 11.0% |
| Mongolians | 100.0 /100 | #31 | Exceptional 11.1% |
| Tongans | 100.0 /100 | #32 | Exceptional 11.1% |
| Egyptians | 100.0 /100 | #33 | Exceptional 11.1% |
| Immigrants | Uzbekistan | 100.0 /100 | #34 | Exceptional 11.1% |
| Cambodians | 100.0 /100 | #35 | Exceptional 11.1% |