Czechoslovakian vs Iraqi Divorced or Separated
COMPARE
Czechoslovakian
Iraqi
Divorced or Separated
Divorced or Separated Comparison
Czechoslovakians
Iraqis
12.3%
DIVORCED OR SEPARATED
11.7/ 100
METRIC RATING
219th/ 347
METRIC RANK
11.8%
DIVORCED OR SEPARATED
94.6/ 100
METRIC RATING
120th/ 347
METRIC RANK
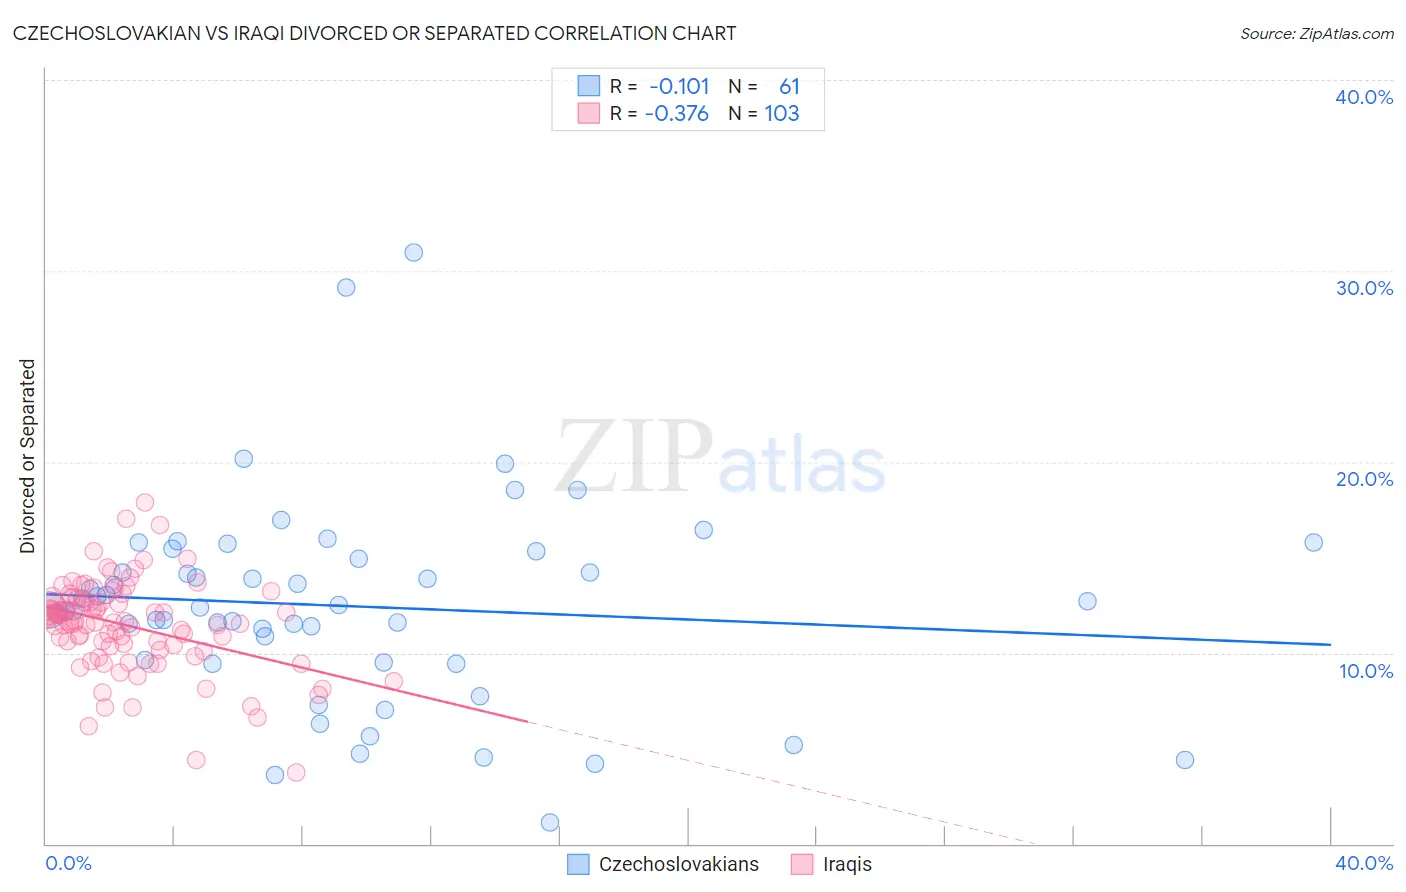
Czechoslovakian vs Iraqi Divorced or Separated Correlation Chart
The statistical analysis conducted on geographies consisting of 368,586,900 people shows a poor negative correlation between the proportion of Czechoslovakians and percentage of population currently divorced or separated in the United States with a correlation coefficient (R) of -0.101 and weighted average of 12.3%. Similarly, the statistical analysis conducted on geographies consisting of 170,608,468 people shows a mild negative correlation between the proportion of Iraqis and percentage of population currently divorced or separated in the United States with a correlation coefficient (R) of -0.376 and weighted average of 11.8%, a difference of 4.3%.
Divorced or Separated Correlation Summary
| Measurement | Czechoslovakian | Iraqi |
| Minimum | 1.1% | 3.7% |
| Maximum | 31.0% | 17.9% |
| Range | 29.9% | 14.2% |
| Mean | 12.5% | 11.4% |
| Median | 12.4% | 11.7% |
| Interquartile 25% (IQ1) | 9.6% | 10.4% |
| Interquartile 75% (IQ3) | 15.1% | 12.7% |
| Interquartile Range (IQR) | 5.5% | 2.4% |
| Standard Deviation (Sample) | 5.3% | 2.4% |
| Standard Deviation (Population) | 5.2% | 2.4% |
Similar Demographics by Divorced or Separated
Demographics Similar to Czechoslovakians by Divorced or Separated
In terms of divorced or separated, the demographic groups most similar to Czechoslovakians are British (12.3%, a difference of 0.010%), Guamanian/Chamorro (12.3%, a difference of 0.030%), Slovene (12.3%, a difference of 0.11%), Bangladeshi (12.3%, a difference of 0.11%), and Scandinavian (12.3%, a difference of 0.11%).
| Demographics | Rating | Rank | Divorced or Separated |
| Immigrants | Kenya | 16.5 /100 | #212 | Poor 12.2% |
| Immigrants | Eastern Africa | 16.2 /100 | #213 | Poor 12.2% |
| Immigrants | Argentina | 15.5 /100 | #214 | Poor 12.2% |
| Europeans | 15.4 /100 | #215 | Poor 12.2% |
| Immigrants | South America | 15.4 /100 | #216 | Poor 12.2% |
| Northern Europeans | 14.7 /100 | #217 | Poor 12.2% |
| Slovenes | 13.2 /100 | #218 | Poor 12.3% |
| Czechoslovakians | 11.7 /100 | #219 | Poor 12.3% |
| British | 11.6 /100 | #220 | Poor 12.3% |
| Guamanians/Chamorros | 11.3 /100 | #221 | Poor 12.3% |
| Bangladeshis | 10.5 /100 | #222 | Poor 12.3% |
| Scandinavians | 10.4 /100 | #223 | Poor 12.3% |
| Immigrants | Azores | 9.7 /100 | #224 | Tragic 12.3% |
| Belgians | 9.7 /100 | #225 | Tragic 12.3% |
| Immigrants | Western Africa | 9.3 /100 | #226 | Tragic 12.3% |
Demographics Similar to Iraqis by Divorced or Separated
In terms of divorced or separated, the demographic groups most similar to Iraqis are Romanian (11.8%, a difference of 0.010%), Syrian (11.7%, a difference of 0.090%), Immigrants from Uganda (11.7%, a difference of 0.13%), Ecuadorian (11.7%, a difference of 0.13%), and Menominee (11.8%, a difference of 0.13%).
| Demographics | Rating | Rank | Divorced or Separated |
| Estonians | 96.6 /100 | #113 | Exceptional 11.7% |
| Immigrants | Norway | 95.9 /100 | #114 | Exceptional 11.7% |
| Lithuanians | 95.7 /100 | #115 | Exceptional 11.7% |
| Immigrants | Iraq | 95.4 /100 | #116 | Exceptional 11.7% |
| Immigrants | Uganda | 95.3 /100 | #117 | Exceptional 11.7% |
| Ecuadorians | 95.3 /100 | #118 | Exceptional 11.7% |
| Syrians | 95.1 /100 | #119 | Exceptional 11.7% |
| Iraqis | 94.6 /100 | #120 | Exceptional 11.8% |
| Romanians | 94.5 /100 | #121 | Exceptional 11.8% |
| Menominee | 93.8 /100 | #122 | Exceptional 11.8% |
| Immigrants | Immigrants | 93.7 /100 | #123 | Exceptional 11.8% |
| Ugandans | 93.1 /100 | #124 | Exceptional 11.8% |
| Ukrainians | 92.3 /100 | #125 | Exceptional 11.8% |
| South American Indians | 92.1 /100 | #126 | Exceptional 11.8% |
| South Africans | 88.9 /100 | #127 | Excellent 11.8% |