Hungarian vs Immigrants from Kuwait Divorced or Separated
COMPARE
Hungarian
Immigrants from Kuwait
Divorced or Separated
Divorced or Separated Comparison
Hungarians
Immigrants from Kuwait
12.0%
DIVORCED OR SEPARATED
70.3/ 100
METRIC RATING
156th/ 347
METRIC RANK
11.3%
DIVORCED OR SEPARATED
99.9/ 100
METRIC RATING
63rd/ 347
METRIC RANK
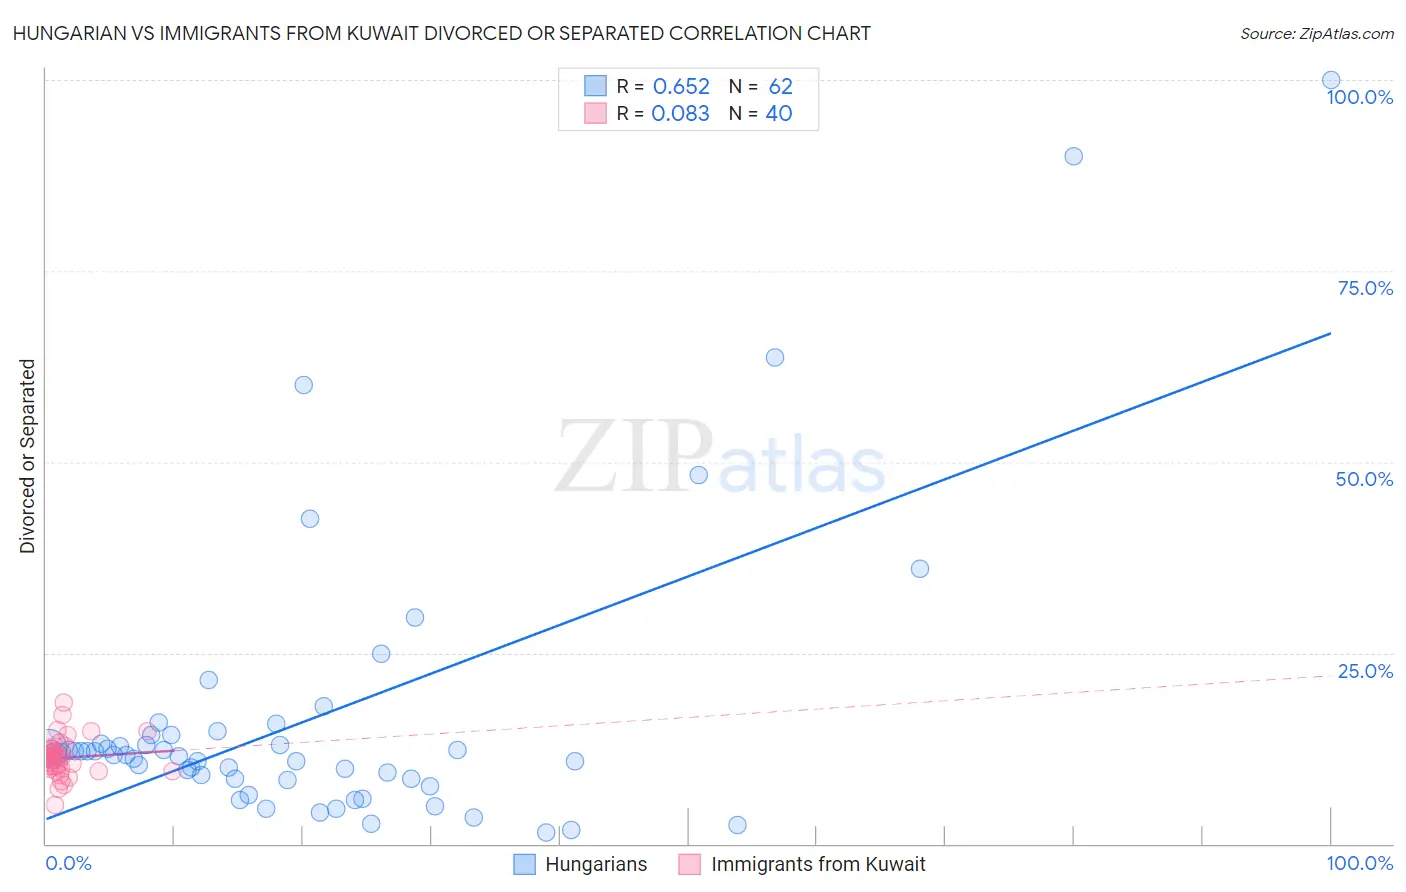
Hungarian vs Immigrants from Kuwait Divorced or Separated Correlation Chart
The statistical analysis conducted on geographies consisting of 485,998,803 people shows a significant positive correlation between the proportion of Hungarians and percentage of population currently divorced or separated in the United States with a correlation coefficient (R) of 0.652 and weighted average of 12.0%. Similarly, the statistical analysis conducted on geographies consisting of 136,881,267 people shows a slight positive correlation between the proportion of Immigrants from Kuwait and percentage of population currently divorced or separated in the United States with a correlation coefficient (R) of 0.083 and weighted average of 11.3%, a difference of 5.4%.
Divorced or Separated Correlation Summary
| Measurement | Hungarian | Immigrants from Kuwait |
| Minimum | 1.4% | 5.1% |
| Maximum | 100.0% | 18.5% |
| Range | 98.6% | 13.4% |
| Mean | 16.6% | 11.3% |
| Median | 11.7% | 11.2% |
| Interquartile 25% (IQ1) | 8.5% | 9.8% |
| Interquartile 75% (IQ3) | 14.2% | 12.4% |
| Interquartile Range (IQR) | 5.8% | 2.6% |
| Standard Deviation (Sample) | 19.0% | 2.5% |
| Standard Deviation (Population) | 18.8% | 2.5% |
Similar Demographics by Divorced or Separated
Demographics Similar to Hungarians by Divorced or Separated
In terms of divorced or separated, the demographic groups most similar to Hungarians are Japanese (12.0%, a difference of 0.020%), Chilean (12.0%, a difference of 0.040%), Immigrants from Brazil (12.0%, a difference of 0.060%), Austrian (12.0%, a difference of 0.080%), and Immigrants from Hungary (11.9%, a difference of 0.15%).
| Demographics | Rating | Rank | Divorced or Separated |
| Immigrants | Oceania | 77.7 /100 | #149 | Good 11.9% |
| Immigrants | Portugal | 77.3 /100 | #150 | Good 11.9% |
| Czechs | 76.4 /100 | #151 | Good 11.9% |
| Immigrants | Hungary | 73.7 /100 | #152 | Good 11.9% |
| Austrians | 72.2 /100 | #153 | Good 12.0% |
| Chileans | 71.3 /100 | #154 | Good 12.0% |
| Japanese | 70.9 /100 | #155 | Good 12.0% |
| Hungarians | 70.3 /100 | #156 | Good 12.0% |
| Immigrants | Brazil | 68.8 /100 | #157 | Good 12.0% |
| Icelanders | 66.0 /100 | #158 | Good 12.0% |
| Immigrants | Barbados | 66.0 /100 | #159 | Good 12.0% |
| Immigrants | Scotland | 65.8 /100 | #160 | Good 12.0% |
| Marshallese | 64.6 /100 | #161 | Good 12.0% |
| Samoans | 64.3 /100 | #162 | Good 12.0% |
| Navajo | 63.9 /100 | #163 | Good 12.0% |
Demographics Similar to Immigrants from Kuwait by Divorced or Separated
In terms of divorced or separated, the demographic groups most similar to Immigrants from Kuwait are Korean (11.3%, a difference of 0.010%), Luxembourger (11.3%, a difference of 0.010%), Immigrants from Russia (11.3%, a difference of 0.020%), Israeli (11.3%, a difference of 0.18%), and Sri Lankan (11.3%, a difference of 0.28%).
| Demographics | Rating | Rank | Divorced or Separated |
| Immigrants | Philippines | 99.9 /100 | #56 | Exceptional 11.3% |
| Immigrants | Vietnam | 99.9 /100 | #57 | Exceptional 11.3% |
| Sri Lankans | 99.9 /100 | #58 | Exceptional 11.3% |
| Israelis | 99.9 /100 | #59 | Exceptional 11.3% |
| Immigrants | Russia | 99.9 /100 | #60 | Exceptional 11.3% |
| Koreans | 99.9 /100 | #61 | Exceptional 11.3% |
| Luxembourgers | 99.9 /100 | #62 | Exceptional 11.3% |
| Immigrants | Kuwait | 99.9 /100 | #63 | Exceptional 11.3% |
| Macedonians | 99.8 /100 | #64 | Exceptional 11.4% |
| Immigrants | South Eastern Asia | 99.8 /100 | #65 | Exceptional 11.4% |
| Inupiat | 99.8 /100 | #66 | Exceptional 11.4% |
| Immigrants | Syria | 99.7 /100 | #67 | Exceptional 11.4% |
| Palestinians | 99.7 /100 | #68 | Exceptional 11.5% |
| Immigrants | Belgium | 99.7 /100 | #69 | Exceptional 11.5% |
| Immigrants | Eastern Europe | 99.7 /100 | #70 | Exceptional 11.5% |