Hungarian vs Immigrants from Caribbean Divorced or Separated
COMPARE
Hungarian
Immigrants from Caribbean
Divorced or Separated
Divorced or Separated Comparison
Hungarians
Immigrants from Caribbean
12.0%
DIVORCED OR SEPARATED
70.3/ 100
METRIC RATING
156th/ 347
METRIC RANK
13.6%
DIVORCED OR SEPARATED
0.0/ 100
METRIC RATING
328th/ 347
METRIC RANK
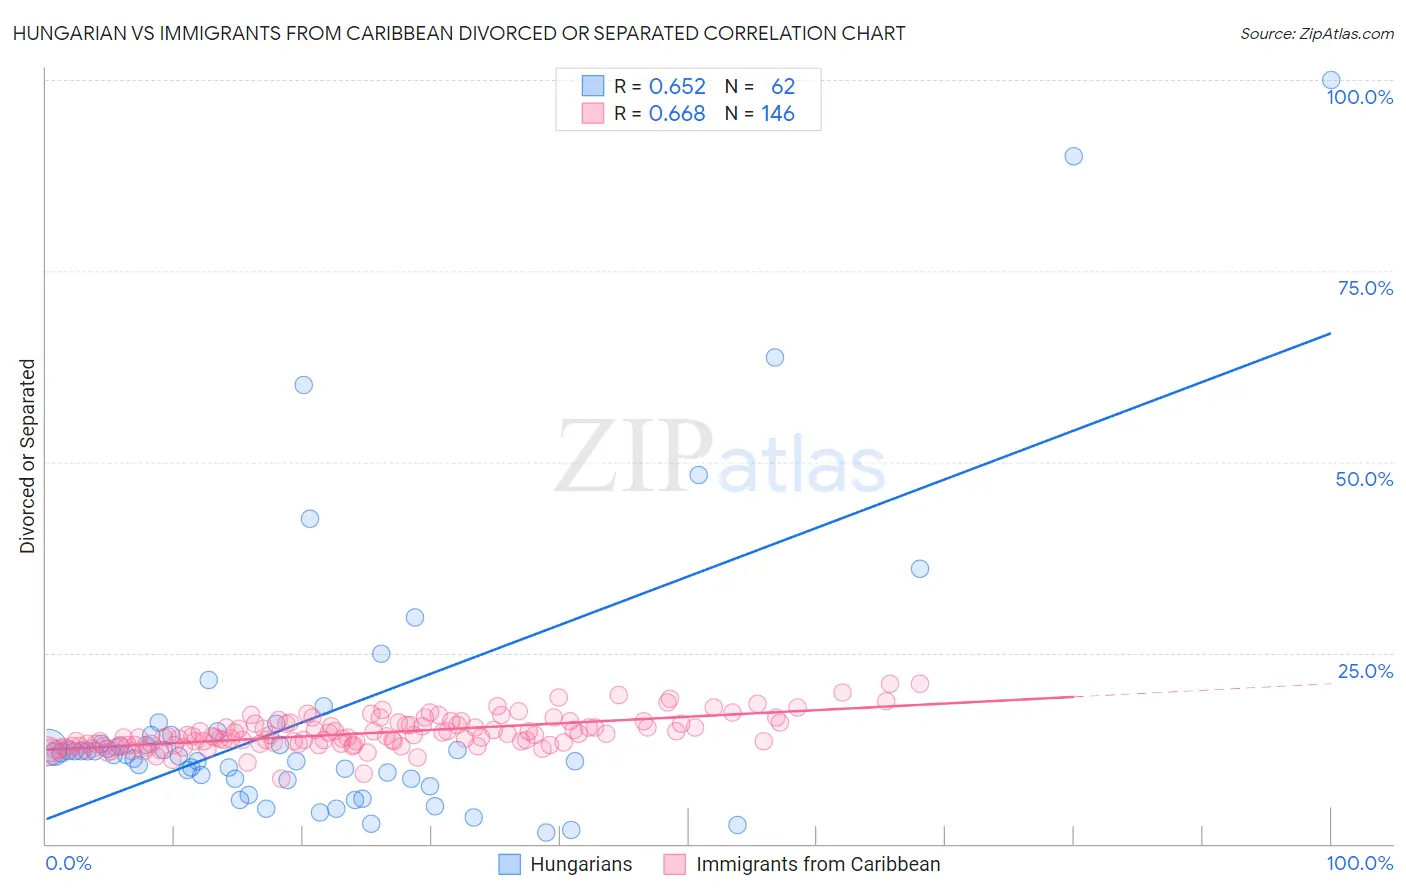
Hungarian vs Immigrants from Caribbean Divorced or Separated Correlation Chart
The statistical analysis conducted on geographies consisting of 485,998,803 people shows a significant positive correlation between the proportion of Hungarians and percentage of population currently divorced or separated in the United States with a correlation coefficient (R) of 0.652 and weighted average of 12.0%. Similarly, the statistical analysis conducted on geographies consisting of 449,832,030 people shows a significant positive correlation between the proportion of Immigrants from Caribbean and percentage of population currently divorced or separated in the United States with a correlation coefficient (R) of 0.668 and weighted average of 13.6%, a difference of 13.5%.
Divorced or Separated Correlation Summary
| Measurement | Hungarian | Immigrants from Caribbean |
| Minimum | 1.4% | 8.5% |
| Maximum | 100.0% | 21.0% |
| Range | 98.6% | 12.5% |
| Mean | 16.6% | 14.4% |
| Median | 11.7% | 14.0% |
| Interquartile 25% (IQ1) | 8.5% | 13.0% |
| Interquartile 75% (IQ3) | 14.2% | 15.7% |
| Interquartile Range (IQR) | 5.8% | 2.7% |
| Standard Deviation (Sample) | 19.0% | 2.1% |
| Standard Deviation (Population) | 18.8% | 2.1% |
Similar Demographics by Divorced or Separated
Demographics Similar to Hungarians by Divorced or Separated
In terms of divorced or separated, the demographic groups most similar to Hungarians are Japanese (12.0%, a difference of 0.020%), Chilean (12.0%, a difference of 0.040%), Immigrants from Brazil (12.0%, a difference of 0.060%), Austrian (12.0%, a difference of 0.080%), and Immigrants from Hungary (11.9%, a difference of 0.15%).
| Demographics | Rating | Rank | Divorced or Separated |
| Immigrants | Oceania | 77.7 /100 | #149 | Good 11.9% |
| Immigrants | Portugal | 77.3 /100 | #150 | Good 11.9% |
| Czechs | 76.4 /100 | #151 | Good 11.9% |
| Immigrants | Hungary | 73.7 /100 | #152 | Good 11.9% |
| Austrians | 72.2 /100 | #153 | Good 12.0% |
| Chileans | 71.3 /100 | #154 | Good 12.0% |
| Japanese | 70.9 /100 | #155 | Good 12.0% |
| Hungarians | 70.3 /100 | #156 | Good 12.0% |
| Immigrants | Brazil | 68.8 /100 | #157 | Good 12.0% |
| Icelanders | 66.0 /100 | #158 | Good 12.0% |
| Immigrants | Barbados | 66.0 /100 | #159 | Good 12.0% |
| Immigrants | Scotland | 65.8 /100 | #160 | Good 12.0% |
| Marshallese | 64.6 /100 | #161 | Good 12.0% |
| Samoans | 64.3 /100 | #162 | Good 12.0% |
| Navajo | 63.9 /100 | #163 | Good 12.0% |
Demographics Similar to Immigrants from Caribbean by Divorced or Separated
In terms of divorced or separated, the demographic groups most similar to Immigrants from Caribbean are Houma (13.6%, a difference of 0.15%), Paiute (13.6%, a difference of 0.26%), Comanche (13.5%, a difference of 0.38%), Black/African American (13.6%, a difference of 0.39%), and Immigrants from Congo (13.5%, a difference of 0.86%).
| Demographics | Rating | Rank | Divorced or Separated |
| Cheyenne | 0.0 /100 | #321 | Tragic 13.4% |
| Immigrants | Haiti | 0.0 /100 | #322 | Tragic 13.4% |
| U.S. Virgin Islanders | 0.0 /100 | #323 | Tragic 13.4% |
| Osage | 0.0 /100 | #324 | Tragic 13.4% |
| Potawatomi | 0.0 /100 | #325 | Tragic 13.5% |
| Immigrants | Congo | 0.0 /100 | #326 | Tragic 13.5% |
| Comanche | 0.0 /100 | #327 | Tragic 13.5% |
| Immigrants | Caribbean | 0.0 /100 | #328 | Tragic 13.6% |
| Houma | 0.0 /100 | #329 | Tragic 13.6% |
| Paiute | 0.0 /100 | #330 | Tragic 13.6% |
| Blacks/African Americans | 0.0 /100 | #331 | Tragic 13.6% |
| Cherokee | 0.0 /100 | #332 | Tragic 13.7% |
| Puerto Ricans | 0.0 /100 | #333 | Tragic 13.9% |
| Immigrants | Bahamas | 0.0 /100 | #334 | Tragic 13.9% |
| Dutch West Indians | 0.0 /100 | #335 | Tragic 14.0% |