Malaysian vs Iraqi Divorced or Separated
COMPARE
Malaysian
Iraqi
Divorced or Separated
Divorced or Separated Comparison
Malaysians
Iraqis
12.4%
DIVORCED OR SEPARATED
4.8/ 100
METRIC RATING
233rd/ 347
METRIC RANK
11.8%
DIVORCED OR SEPARATED
94.6/ 100
METRIC RATING
120th/ 347
METRIC RANK
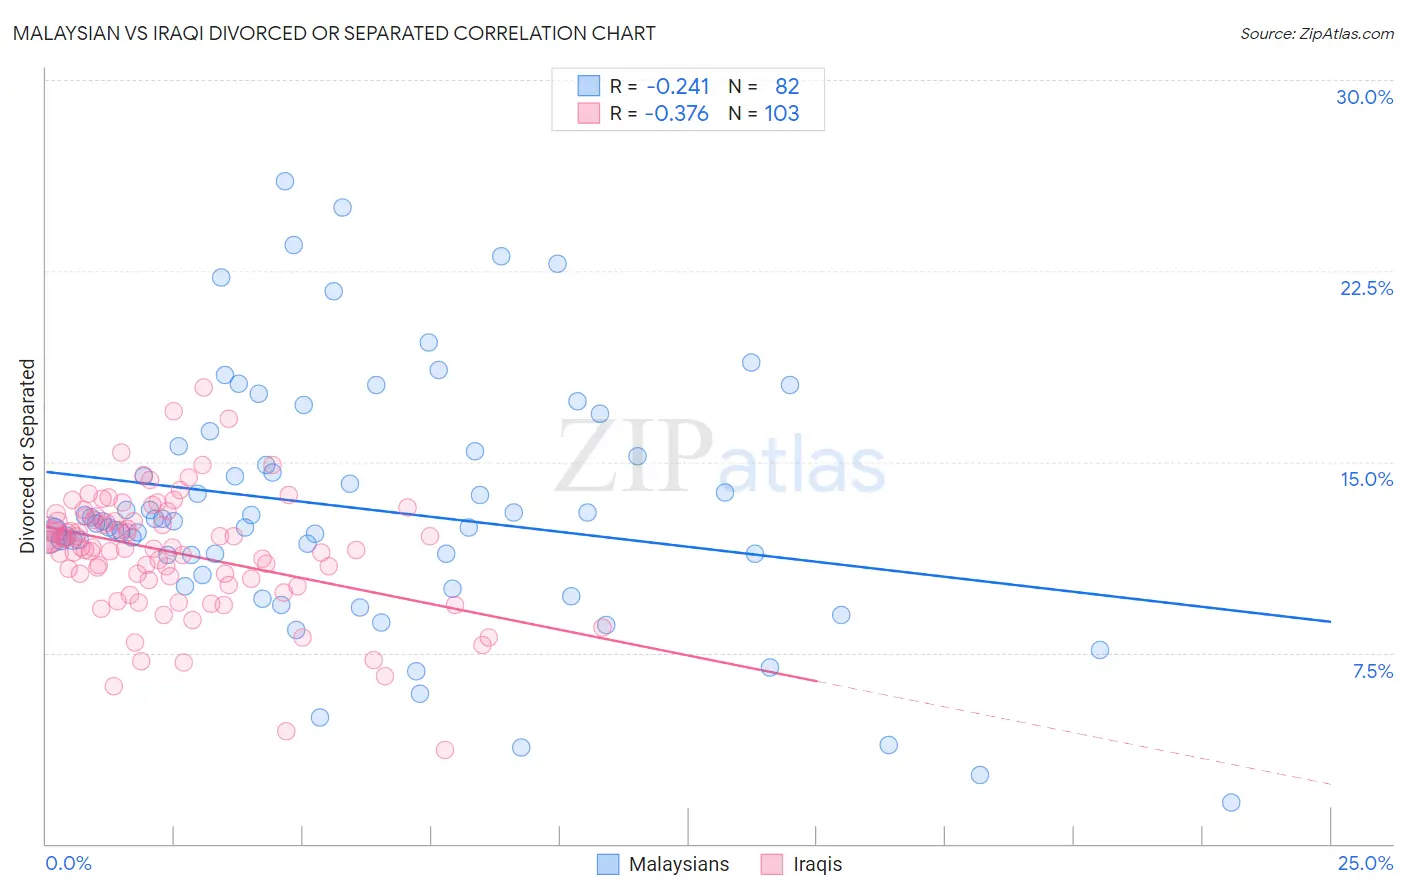
Malaysian vs Iraqi Divorced or Separated Correlation Chart
The statistical analysis conducted on geographies consisting of 226,068,380 people shows a weak negative correlation between the proportion of Malaysians and percentage of population currently divorced or separated in the United States with a correlation coefficient (R) of -0.241 and weighted average of 12.4%. Similarly, the statistical analysis conducted on geographies consisting of 170,608,468 people shows a mild negative correlation between the proportion of Iraqis and percentage of population currently divorced or separated in the United States with a correlation coefficient (R) of -0.376 and weighted average of 11.8%, a difference of 5.2%.
Divorced or Separated Correlation Summary
| Measurement | Malaysian | Iraqi |
| Minimum | 1.6% | 3.7% |
| Maximum | 26.0% | 17.9% |
| Range | 24.4% | 14.2% |
| Mean | 13.2% | 11.4% |
| Median | 12.6% | 11.7% |
| Interquartile 25% (IQ1) | 11.4% | 10.4% |
| Interquartile 75% (IQ3) | 15.4% | 12.7% |
| Interquartile Range (IQR) | 4.0% | 2.4% |
| Standard Deviation (Sample) | 4.9% | 2.4% |
| Standard Deviation (Population) | 4.8% | 2.4% |
Similar Demographics by Divorced or Separated
Demographics Similar to Malaysians by Divorced or Separated
In terms of divorced or separated, the demographic groups most similar to Malaysians are West Indian (12.4%, a difference of 0.080%), Canadian (12.4%, a difference of 0.090%), Immigrants from Bosnia and Herzegovina (12.4%, a difference of 0.10%), Colombian (12.4%, a difference of 0.13%), and Immigrants from Laos (12.4%, a difference of 0.13%).
| Demographics | Rating | Rank | Divorced or Separated |
| Immigrants | Western Africa | 9.3 /100 | #226 | Tragic 12.3% |
| Hmong | 8.8 /100 | #227 | Tragic 12.3% |
| Immigrants | Cameroon | 8.3 /100 | #228 | Tragic 12.3% |
| Immigrants | Sudan | 8.2 /100 | #229 | Tragic 12.3% |
| Yakama | 7.8 /100 | #230 | Tragic 12.3% |
| Yugoslavians | 6.6 /100 | #231 | Tragic 12.3% |
| Canadians | 5.3 /100 | #232 | Tragic 12.4% |
| Malaysians | 4.8 /100 | #233 | Tragic 12.4% |
| West Indians | 4.4 /100 | #234 | Tragic 12.4% |
| Immigrants | Bosnia and Herzegovina | 4.3 /100 | #235 | Tragic 12.4% |
| Colombians | 4.2 /100 | #236 | Tragic 12.4% |
| Immigrants | Laos | 4.2 /100 | #237 | Tragic 12.4% |
| Sudanese | 4.0 /100 | #238 | Tragic 12.4% |
| Immigrants | Germany | 4.0 /100 | #239 | Tragic 12.4% |
| British West Indians | 3.7 /100 | #240 | Tragic 12.4% |
Demographics Similar to Iraqis by Divorced or Separated
In terms of divorced or separated, the demographic groups most similar to Iraqis are Romanian (11.8%, a difference of 0.010%), Syrian (11.7%, a difference of 0.090%), Immigrants from Uganda (11.7%, a difference of 0.13%), Ecuadorian (11.7%, a difference of 0.13%), and Menominee (11.8%, a difference of 0.13%).
| Demographics | Rating | Rank | Divorced or Separated |
| Estonians | 96.6 /100 | #113 | Exceptional 11.7% |
| Immigrants | Norway | 95.9 /100 | #114 | Exceptional 11.7% |
| Lithuanians | 95.7 /100 | #115 | Exceptional 11.7% |
| Immigrants | Iraq | 95.4 /100 | #116 | Exceptional 11.7% |
| Immigrants | Uganda | 95.3 /100 | #117 | Exceptional 11.7% |
| Ecuadorians | 95.3 /100 | #118 | Exceptional 11.7% |
| Syrians | 95.1 /100 | #119 | Exceptional 11.7% |
| Iraqis | 94.6 /100 | #120 | Exceptional 11.8% |
| Romanians | 94.5 /100 | #121 | Exceptional 11.8% |
| Menominee | 93.8 /100 | #122 | Exceptional 11.8% |
| Immigrants | Immigrants | 93.7 /100 | #123 | Exceptional 11.8% |
| Ugandans | 93.1 /100 | #124 | Exceptional 11.8% |
| Ukrainians | 92.3 /100 | #125 | Exceptional 11.8% |
| South American Indians | 92.1 /100 | #126 | Exceptional 11.8% |
| South Africans | 88.9 /100 | #127 | Excellent 11.8% |