Houma vs Romanian Divorced or Separated
COMPARE
Houma
Romanian
Divorced or Separated
Divorced or Separated Comparison
Houma
Romanians
13.6%
DIVORCED OR SEPARATED
0.0/ 100
METRIC RATING
329th/ 347
METRIC RANK
11.8%
DIVORCED OR SEPARATED
94.5/ 100
METRIC RATING
121st/ 347
METRIC RANK
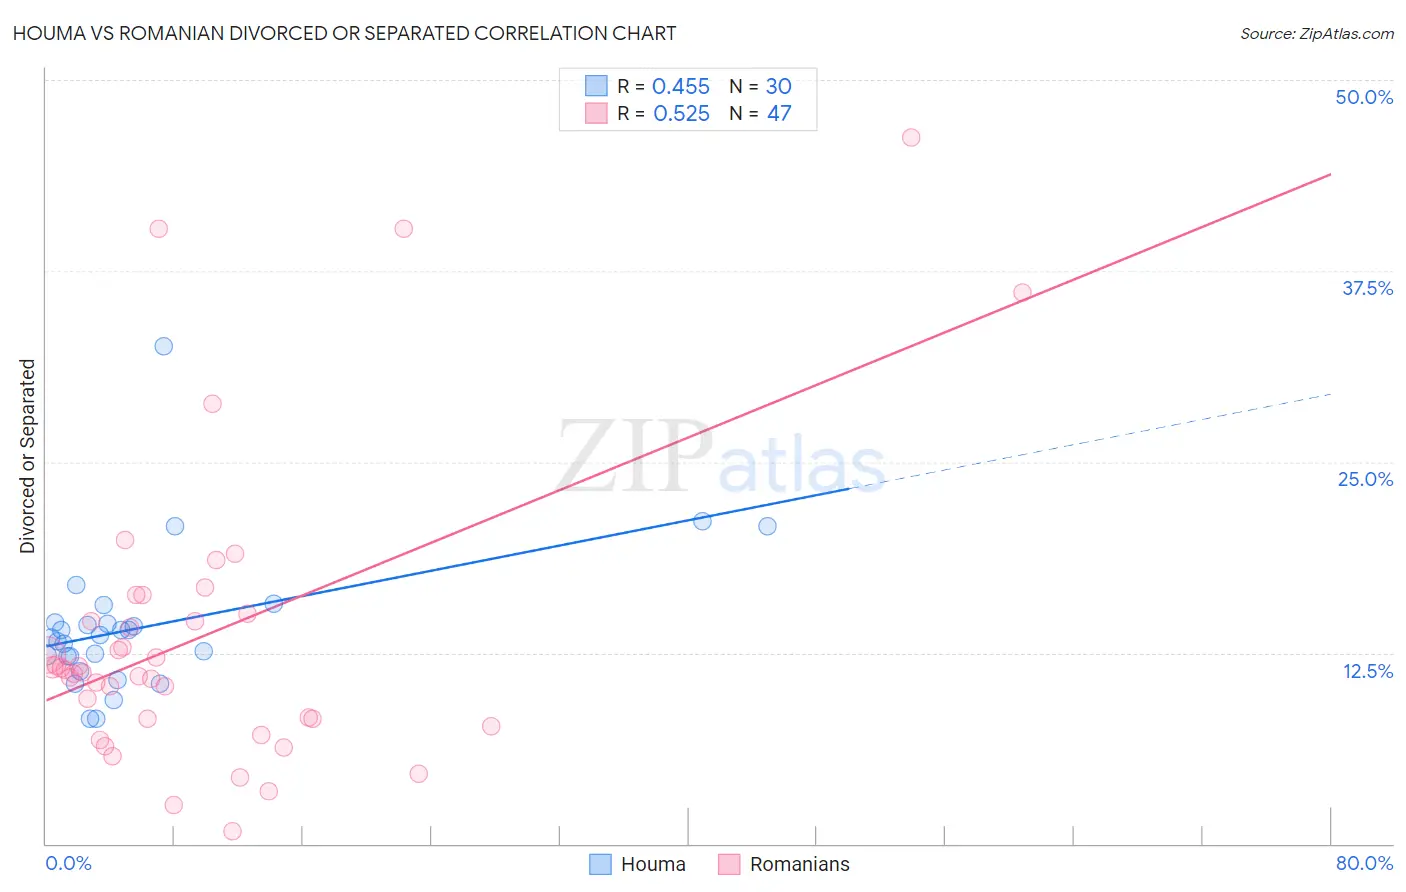
Houma vs Romanian Divorced or Separated Correlation Chart
The statistical analysis conducted on geographies consisting of 36,793,405 people shows a moderate positive correlation between the proportion of Houma and percentage of population currently divorced or separated in the United States with a correlation coefficient (R) of 0.455 and weighted average of 13.6%. Similarly, the statistical analysis conducted on geographies consisting of 377,785,427 people shows a substantial positive correlation between the proportion of Romanians and percentage of population currently divorced or separated in the United States with a correlation coefficient (R) of 0.525 and weighted average of 11.8%, a difference of 15.6%.
Divorced or Separated Correlation Summary
| Measurement | Houma | Romanian |
| Minimum | 8.2% | 0.80% |
| Maximum | 32.6% | 46.2% |
| Range | 24.4% | 45.4% |
| Mean | 14.2% | 13.6% |
| Median | 13.6% | 11.4% |
| Interquartile 25% (IQ1) | 12.3% | 8.2% |
| Interquartile 75% (IQ3) | 14.5% | 15.0% |
| Interquartile Range (IQR) | 2.2% | 6.8% |
| Standard Deviation (Sample) | 4.7% | 9.8% |
| Standard Deviation (Population) | 4.6% | 9.7% |
Similar Demographics by Divorced or Separated
Demographics Similar to Houma by Divorced or Separated
In terms of divorced or separated, the demographic groups most similar to Houma are Paiute (13.6%, a difference of 0.11%), Immigrants from Caribbean (13.6%, a difference of 0.15%), Black/African American (13.6%, a difference of 0.24%), Comanche (13.5%, a difference of 0.53%), and Cherokee (13.7%, a difference of 1.0%).
| Demographics | Rating | Rank | Divorced or Separated |
| Immigrants | Haiti | 0.0 /100 | #322 | Tragic 13.4% |
| U.S. Virgin Islanders | 0.0 /100 | #323 | Tragic 13.4% |
| Osage | 0.0 /100 | #324 | Tragic 13.4% |
| Potawatomi | 0.0 /100 | #325 | Tragic 13.5% |
| Immigrants | Congo | 0.0 /100 | #326 | Tragic 13.5% |
| Comanche | 0.0 /100 | #327 | Tragic 13.5% |
| Immigrants | Caribbean | 0.0 /100 | #328 | Tragic 13.6% |
| Houma | 0.0 /100 | #329 | Tragic 13.6% |
| Paiute | 0.0 /100 | #330 | Tragic 13.6% |
| Blacks/African Americans | 0.0 /100 | #331 | Tragic 13.6% |
| Cherokee | 0.0 /100 | #332 | Tragic 13.7% |
| Puerto Ricans | 0.0 /100 | #333 | Tragic 13.9% |
| Immigrants | Bahamas | 0.0 /100 | #334 | Tragic 13.9% |
| Dutch West Indians | 0.0 /100 | #335 | Tragic 14.0% |
| Shoshone | 0.0 /100 | #336 | Tragic 14.0% |
Demographics Similar to Romanians by Divorced or Separated
In terms of divorced or separated, the demographic groups most similar to Romanians are Iraqi (11.8%, a difference of 0.010%), Syrian (11.7%, a difference of 0.10%), Menominee (11.8%, a difference of 0.12%), Immigrants (11.8%, a difference of 0.13%), and Ecuadorian (11.7%, a difference of 0.14%).
| Demographics | Rating | Rank | Divorced or Separated |
| Immigrants | Norway | 95.9 /100 | #114 | Exceptional 11.7% |
| Lithuanians | 95.7 /100 | #115 | Exceptional 11.7% |
| Immigrants | Iraq | 95.4 /100 | #116 | Exceptional 11.7% |
| Immigrants | Uganda | 95.3 /100 | #117 | Exceptional 11.7% |
| Ecuadorians | 95.3 /100 | #118 | Exceptional 11.7% |
| Syrians | 95.1 /100 | #119 | Exceptional 11.7% |
| Iraqis | 94.6 /100 | #120 | Exceptional 11.8% |
| Romanians | 94.5 /100 | #121 | Exceptional 11.8% |
| Menominee | 93.8 /100 | #122 | Exceptional 11.8% |
| Immigrants | Immigrants | 93.7 /100 | #123 | Exceptional 11.8% |
| Ugandans | 93.1 /100 | #124 | Exceptional 11.8% |
| Ukrainians | 92.3 /100 | #125 | Exceptional 11.8% |
| South American Indians | 92.1 /100 | #126 | Exceptional 11.8% |
| South Africans | 88.9 /100 | #127 | Excellent 11.8% |
| Immigrants | Ecuador | 88.9 /100 | #128 | Excellent 11.8% |