Slavic vs Immigrants from Hong Kong Divorced or Separated
COMPARE
Slavic
Immigrants from Hong Kong
Divorced or Separated
Divorced or Separated Comparison
Slavs
Immigrants from Hong Kong
12.2%
DIVORCED OR SEPARATED
17.0/ 100
METRIC RATING
210th/ 347
METRIC RANK
10.0%
DIVORCED OR SEPARATED
100.0/ 100
METRIC RATING
3rd/ 347
METRIC RANK
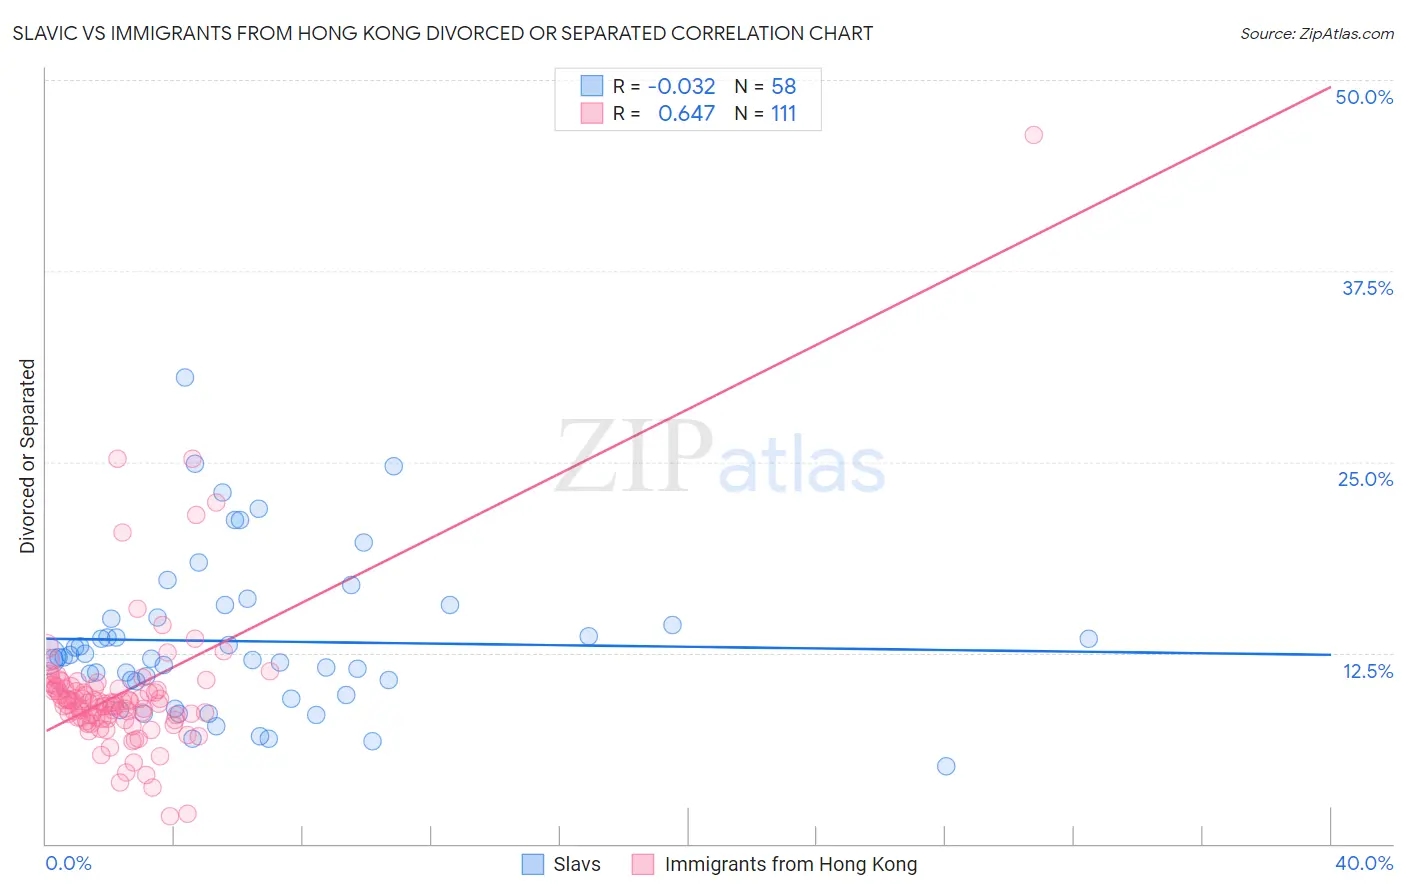
Slavic vs Immigrants from Hong Kong Divorced or Separated Correlation Chart
The statistical analysis conducted on geographies consisting of 270,842,560 people shows no correlation between the proportion of Slavs and percentage of population currently divorced or separated in the United States with a correlation coefficient (R) of -0.032 and weighted average of 12.2%. Similarly, the statistical analysis conducted on geographies consisting of 253,935,113 people shows a significant positive correlation between the proportion of Immigrants from Hong Kong and percentage of population currently divorced or separated in the United States with a correlation coefficient (R) of 0.647 and weighted average of 10.0%, a difference of 22.6%.
Divorced or Separated Correlation Summary
| Measurement | Slavic | Immigrants from Hong Kong |
| Minimum | 5.1% | 1.8% |
| Maximum | 30.5% | 46.4% |
| Range | 25.4% | 44.6% |
| Mean | 13.3% | 9.9% |
| Median | 12.2% | 9.2% |
| Interquartile 25% (IQ1) | 10.6% | 8.2% |
| Interquartile 75% (IQ3) | 14.8% | 10.2% |
| Interquartile Range (IQR) | 4.2% | 2.0% |
| Standard Deviation (Sample) | 5.1% | 5.0% |
| Standard Deviation (Population) | 5.0% | 5.0% |
Similar Demographics by Divorced or Separated
Demographics Similar to Slavs by Divorced or Separated
In terms of divorced or separated, the demographic groups most similar to Slavs are Trinidadian and Tobagonian (12.2%, a difference of 0.020%), Immigrants from Kenya (12.2%, a difference of 0.030%), Immigrants from Trinidad and Tobago (12.2%, a difference of 0.050%), Immigrants from Eastern Africa (12.2%, a difference of 0.050%), and Immigrants from Argentina (12.2%, a difference of 0.090%).
| Demographics | Rating | Rank | Divorced or Separated |
| Immigrants | Guatemala | 23.2 /100 | #203 | Fair 12.2% |
| Kenyans | 21.8 /100 | #204 | Fair 12.2% |
| Immigrants | Costa Rica | 21.3 /100 | #205 | Fair 12.2% |
| Slovaks | 21.0 /100 | #206 | Fair 12.2% |
| Mexicans | 21.0 /100 | #207 | Fair 12.2% |
| Immigrants | Ghana | 18.8 /100 | #208 | Poor 12.2% |
| Immigrants | Trinidad and Tobago | 17.8 /100 | #209 | Poor 12.2% |
| Slavs | 17.0 /100 | #210 | Poor 12.2% |
| Trinidadians and Tobagonians | 16.6 /100 | #211 | Poor 12.2% |
| Immigrants | Kenya | 16.5 /100 | #212 | Poor 12.2% |
| Immigrants | Eastern Africa | 16.2 /100 | #213 | Poor 12.2% |
| Immigrants | Argentina | 15.5 /100 | #214 | Poor 12.2% |
| Europeans | 15.4 /100 | #215 | Poor 12.2% |
| Immigrants | South America | 15.4 /100 | #216 | Poor 12.2% |
| Northern Europeans | 14.7 /100 | #217 | Poor 12.2% |
Demographics Similar to Immigrants from Hong Kong by Divorced or Separated
In terms of divorced or separated, the demographic groups most similar to Immigrants from Hong Kong are Filipino (9.9%, a difference of 0.56%), Immigrants from China (10.0%, a difference of 0.72%), Immigrants from India (10.1%, a difference of 0.96%), Immigrants from Taiwan (9.8%, a difference of 1.6%), and Indian (Asian) (10.2%, a difference of 2.3%).
| Demographics | Rating | Rank | Divorced or Separated |
| Immigrants | Taiwan | 100.0 /100 | #1 | Exceptional 9.8% |
| Filipinos | 100.0 /100 | #2 | Exceptional 9.9% |
| Immigrants | Hong Kong | 100.0 /100 | #3 | Exceptional 10.0% |
| Immigrants | China | 100.0 /100 | #4 | Exceptional 10.0% |
| Immigrants | India | 100.0 /100 | #5 | Exceptional 10.1% |
| Indians (Asian) | 100.0 /100 | #6 | Exceptional 10.2% |
| Thais | 100.0 /100 | #7 | Exceptional 10.2% |
| Immigrants | Eastern Asia | 100.0 /100 | #8 | Exceptional 10.2% |
| Yup'ik | 100.0 /100 | #9 | Exceptional 10.3% |
| Immigrants | Singapore | 100.0 /100 | #10 | Exceptional 10.3% |
| Immigrants | South Central Asia | 100.0 /100 | #11 | Exceptional 10.4% |
| Okinawans | 100.0 /100 | #12 | Exceptional 10.5% |
| Cypriots | 100.0 /100 | #13 | Exceptional 10.5% |
| Assyrians/Chaldeans/Syriacs | 100.0 /100 | #14 | Exceptional 10.6% |
| Immigrants | Armenia | 100.0 /100 | #15 | Exceptional 10.6% |