Houma vs Immigrants from Cameroon Divorced or Separated
COMPARE
Houma
Immigrants from Cameroon
Divorced or Separated
Divorced or Separated Comparison
Houma
Immigrants from Cameroon
13.6%
DIVORCED OR SEPARATED
0.0/ 100
METRIC RATING
329th/ 347
METRIC RANK
12.3%
DIVORCED OR SEPARATED
8.3/ 100
METRIC RATING
228th/ 347
METRIC RANK
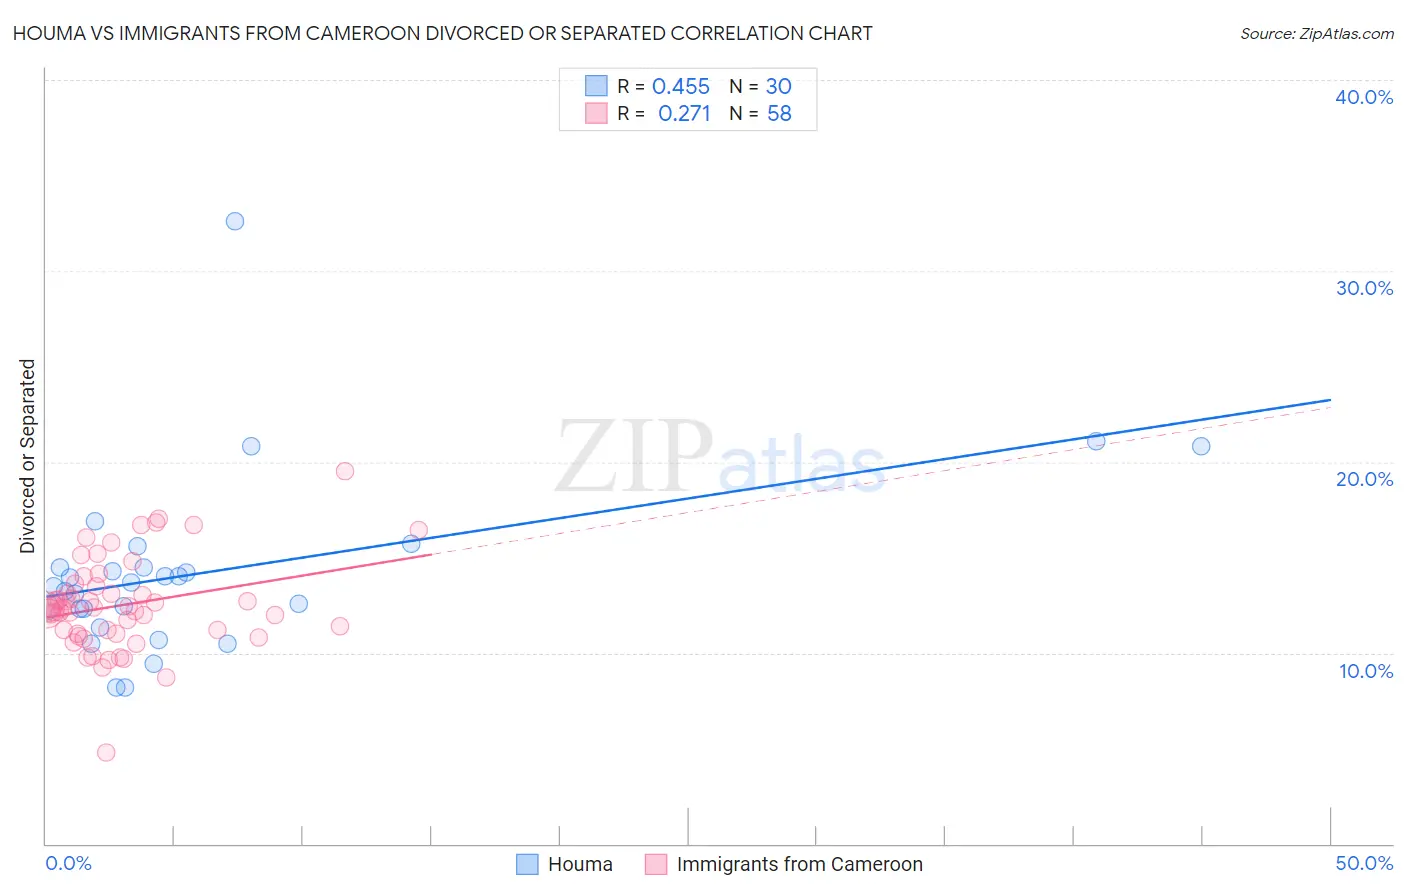
Houma vs Immigrants from Cameroon Divorced or Separated Correlation Chart
The statistical analysis conducted on geographies consisting of 36,793,405 people shows a moderate positive correlation between the proportion of Houma and percentage of population currently divorced or separated in the United States with a correlation coefficient (R) of 0.455 and weighted average of 13.6%. Similarly, the statistical analysis conducted on geographies consisting of 130,744,662 people shows a weak positive correlation between the proportion of Immigrants from Cameroon and percentage of population currently divorced or separated in the United States with a correlation coefficient (R) of 0.271 and weighted average of 12.3%, a difference of 10.5%.
Divorced or Separated Correlation Summary
| Measurement | Houma | Immigrants from Cameroon |
| Minimum | 8.2% | 4.8% |
| Maximum | 32.6% | 19.5% |
| Range | 24.4% | 14.7% |
| Mean | 14.2% | 12.5% |
| Median | 13.6% | 12.3% |
| Interquartile 25% (IQ1) | 12.3% | 11.0% |
| Interquartile 75% (IQ3) | 14.5% | 13.5% |
| Interquartile Range (IQR) | 2.2% | 2.5% |
| Standard Deviation (Sample) | 4.7% | 2.4% |
| Standard Deviation (Population) | 4.6% | 2.4% |
Similar Demographics by Divorced or Separated
Demographics Similar to Houma by Divorced or Separated
In terms of divorced or separated, the demographic groups most similar to Houma are Paiute (13.6%, a difference of 0.11%), Immigrants from Caribbean (13.6%, a difference of 0.15%), Black/African American (13.6%, a difference of 0.24%), Comanche (13.5%, a difference of 0.53%), and Cherokee (13.7%, a difference of 1.0%).
| Demographics | Rating | Rank | Divorced or Separated |
| Immigrants | Haiti | 0.0 /100 | #322 | Tragic 13.4% |
| U.S. Virgin Islanders | 0.0 /100 | #323 | Tragic 13.4% |
| Osage | 0.0 /100 | #324 | Tragic 13.4% |
| Potawatomi | 0.0 /100 | #325 | Tragic 13.5% |
| Immigrants | Congo | 0.0 /100 | #326 | Tragic 13.5% |
| Comanche | 0.0 /100 | #327 | Tragic 13.5% |
| Immigrants | Caribbean | 0.0 /100 | #328 | Tragic 13.6% |
| Houma | 0.0 /100 | #329 | Tragic 13.6% |
| Paiute | 0.0 /100 | #330 | Tragic 13.6% |
| Blacks/African Americans | 0.0 /100 | #331 | Tragic 13.6% |
| Cherokee | 0.0 /100 | #332 | Tragic 13.7% |
| Puerto Ricans | 0.0 /100 | #333 | Tragic 13.9% |
| Immigrants | Bahamas | 0.0 /100 | #334 | Tragic 13.9% |
| Dutch West Indians | 0.0 /100 | #335 | Tragic 14.0% |
| Shoshone | 0.0 /100 | #336 | Tragic 14.0% |
Demographics Similar to Immigrants from Cameroon by Divorced or Separated
In terms of divorced or separated, the demographic groups most similar to Immigrants from Cameroon are Immigrants from Sudan (12.3%, a difference of 0.020%), Hmong (12.3%, a difference of 0.050%), Yakama (12.3%, a difference of 0.060%), Immigrants from Western Africa (12.3%, a difference of 0.10%), and Immigrants from the Azores (12.3%, a difference of 0.14%).
| Demographics | Rating | Rank | Divorced or Separated |
| Guamanians/Chamorros | 11.3 /100 | #221 | Poor 12.3% |
| Bangladeshis | 10.5 /100 | #222 | Poor 12.3% |
| Scandinavians | 10.4 /100 | #223 | Poor 12.3% |
| Immigrants | Azores | 9.7 /100 | #224 | Tragic 12.3% |
| Belgians | 9.7 /100 | #225 | Tragic 12.3% |
| Immigrants | Western Africa | 9.3 /100 | #226 | Tragic 12.3% |
| Hmong | 8.8 /100 | #227 | Tragic 12.3% |
| Immigrants | Cameroon | 8.3 /100 | #228 | Tragic 12.3% |
| Immigrants | Sudan | 8.2 /100 | #229 | Tragic 12.3% |
| Yakama | 7.8 /100 | #230 | Tragic 12.3% |
| Yugoslavians | 6.6 /100 | #231 | Tragic 12.3% |
| Canadians | 5.3 /100 | #232 | Tragic 12.4% |
| Malaysians | 4.8 /100 | #233 | Tragic 12.4% |
| West Indians | 4.4 /100 | #234 | Tragic 12.4% |
| Immigrants | Bosnia and Herzegovina | 4.3 /100 | #235 | Tragic 12.4% |