Hmong vs Immigrants from West Indies Single Mother Households
COMPARE
Hmong
Immigrants from West Indies
Single Mother Households
Single Mother Households Comparison
Hmong
Immigrants from West Indies
6.4%
SINGLE MOTHER HOUSEHOLDS
39.8/ 100
METRIC RATING
179th/ 347
METRIC RANK
7.9%
SINGLE MOTHER HOUSEHOLDS
0.0/ 100
METRIC RATING
298th/ 347
METRIC RANK
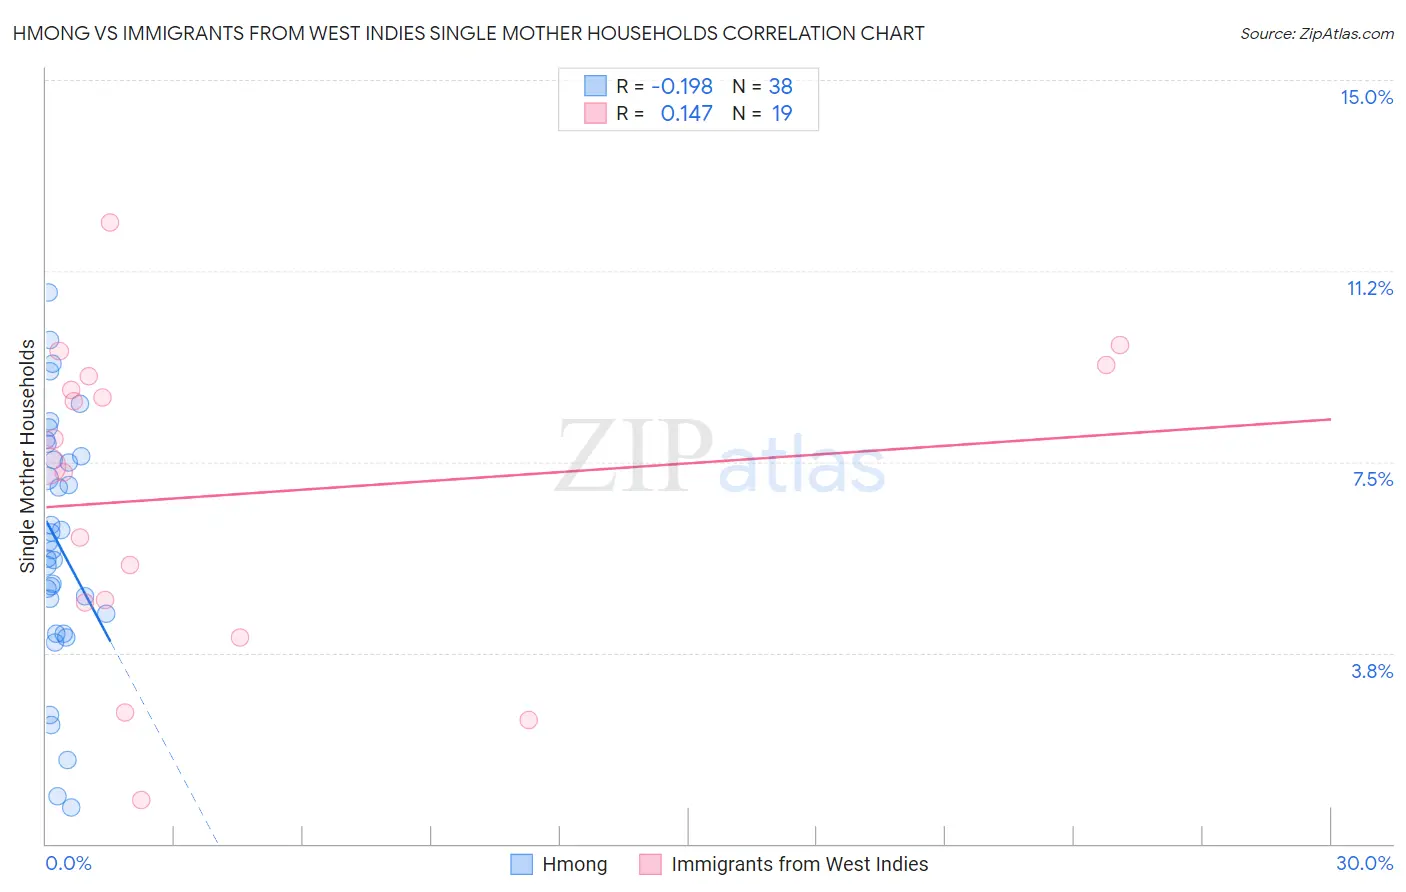
Hmong vs Immigrants from West Indies Single Mother Households Correlation Chart
The statistical analysis conducted on geographies consisting of 24,669,739 people shows a poor negative correlation between the proportion of Hmong and percentage of single mother households in the United States with a correlation coefficient (R) of -0.198 and weighted average of 6.4%. Similarly, the statistical analysis conducted on geographies consisting of 72,447,708 people shows a poor positive correlation between the proportion of Immigrants from West Indies and percentage of single mother households in the United States with a correlation coefficient (R) of 0.147 and weighted average of 7.9%, a difference of 24.1%.
Single Mother Households Correlation Summary
| Measurement | Hmong | Immigrants from West Indies |
| Minimum | 0.72% | 0.85% |
| Maximum | 10.8% | 12.2% |
| Range | 10.1% | 11.4% |
| Mean | 5.9% | 6.9% |
| Median | 5.8% | 7.4% |
| Interquartile 25% (IQ1) | 4.5% | 4.7% |
| Interquartile 75% (IQ3) | 7.6% | 9.2% |
| Interquartile Range (IQR) | 3.1% | 4.4% |
| Standard Deviation (Sample) | 2.4% | 3.0% |
| Standard Deviation (Population) | 2.4% | 2.9% |
Similar Demographics by Single Mother Households
Demographics Similar to Hmong by Single Mother Households
In terms of single mother households, the demographic groups most similar to Hmong are Portuguese (6.4%, a difference of 0.020%), Osage (6.4%, a difference of 0.36%), Immigrants from Nepal (6.4%, a difference of 0.43%), Immigrants from Bosnia and Herzegovina (6.3%, a difference of 0.51%), and Marshallese (6.3%, a difference of 0.67%).
| Demographics | Rating | Rank | Single Mother Households |
| Immigrants | South Eastern Asia | 52.2 /100 | #172 | Average 6.3% |
| Immigrants | Vietnam | 51.5 /100 | #173 | Average 6.3% |
| Immigrants | Morocco | 50.0 /100 | #174 | Average 6.3% |
| Marshallese | 45.8 /100 | #175 | Average 6.3% |
| Immigrants | Bosnia and Herzegovina | 44.3 /100 | #176 | Average 6.3% |
| Osage | 43.0 /100 | #177 | Average 6.4% |
| Portuguese | 40.0 /100 | #178 | Fair 6.4% |
| Hmong | 39.8 /100 | #179 | Fair 6.4% |
| Immigrants | Nepal | 36.1 /100 | #180 | Fair 6.4% |
| Spanish | 33.4 /100 | #181 | Fair 6.4% |
| South American Indians | 33.4 /100 | #182 | Fair 6.4% |
| Spaniards | 27.8 /100 | #183 | Fair 6.5% |
| Ethiopians | 26.0 /100 | #184 | Fair 6.5% |
| Ugandans | 25.6 /100 | #185 | Fair 6.5% |
| Costa Ricans | 24.8 /100 | #186 | Fair 6.5% |
Demographics Similar to Immigrants from West Indies by Single Mother Households
In terms of single mother households, the demographic groups most similar to Immigrants from West Indies are Houma (7.9%, a difference of 0.080%), Hispanic or Latino (7.9%, a difference of 0.11%), Immigrants from Latin America (7.9%, a difference of 0.15%), Barbadian (7.9%, a difference of 0.22%), and Apache (7.9%, a difference of 0.51%).
| Demographics | Rating | Rank | Single Mother Households |
| West Indians | 0.0 /100 | #291 | Tragic 7.8% |
| Ghanaians | 0.0 /100 | #292 | Tragic 7.8% |
| Immigrants | Cameroon | 0.0 /100 | #293 | Tragic 7.9% |
| Apache | 0.0 /100 | #294 | Tragic 7.9% |
| Barbadians | 0.0 /100 | #295 | Tragic 7.9% |
| Immigrants | Latin America | 0.0 /100 | #296 | Tragic 7.9% |
| Hispanics or Latinos | 0.0 /100 | #297 | Tragic 7.9% |
| Immigrants | West Indies | 0.0 /100 | #298 | Tragic 7.9% |
| Houma | 0.0 /100 | #299 | Tragic 7.9% |
| Mexicans | 0.0 /100 | #300 | Tragic 8.0% |
| Chippewa | 0.0 /100 | #301 | Tragic 8.0% |
| Immigrants | Ghana | 0.0 /100 | #302 | Tragic 8.0% |
| Immigrants | Bahamas | 0.0 /100 | #303 | Tragic 8.0% |
| Natives/Alaskans | 0.0 /100 | #304 | Tragic 8.0% |
| Colville | 0.0 /100 | #305 | Tragic 8.0% |