Immigrants vs Chickasaw Single Mother Households
COMPARE
Immigrants
Chickasaw
Single Mother Households
Single Mother Households Comparison
Immigrants
Chickasaw
6.8%
SINGLE MOTHER HOUSEHOLDS
4.3/ 100
METRIC RATING
219th/ 347
METRIC RANK
7.0%
SINGLE MOTHER HOUSEHOLDS
1.4/ 100
METRIC RATING
234th/ 347
METRIC RANK
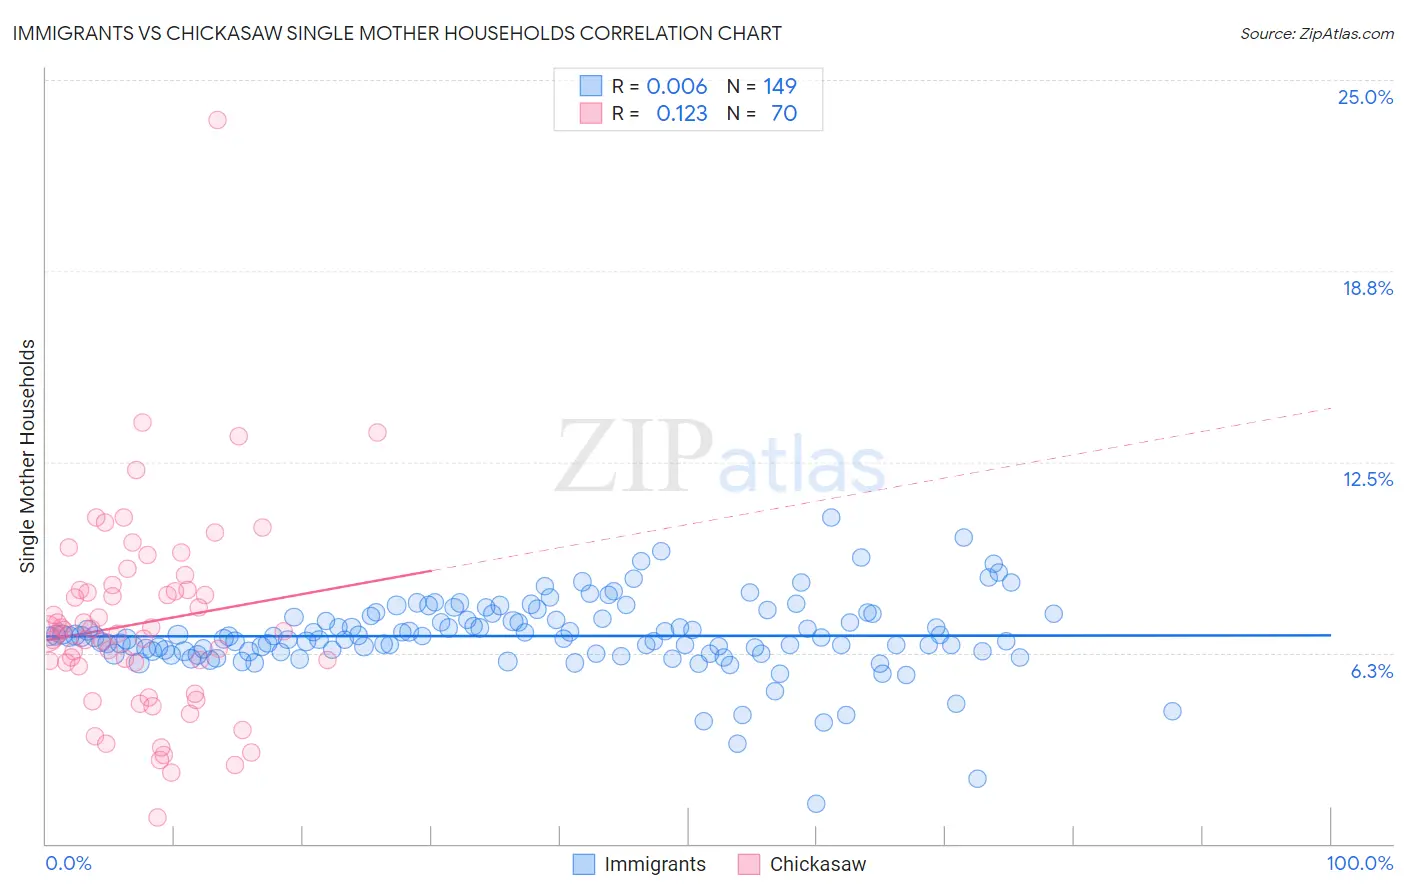
Immigrants vs Chickasaw Single Mother Households Correlation Chart
The statistical analysis conducted on geographies consisting of 572,041,298 people shows no correlation between the proportion of Immigrants and percentage of single mother households in the United States with a correlation coefficient (R) of 0.006 and weighted average of 6.8%. Similarly, the statistical analysis conducted on geographies consisting of 147,547,774 people shows a poor positive correlation between the proportion of Chickasaw and percentage of single mother households in the United States with a correlation coefficient (R) of 0.123 and weighted average of 7.0%, a difference of 2.9%.
Single Mother Households Correlation Summary
| Measurement | Immigrants | Chickasaw |
| Minimum | 1.3% | 0.84% |
| Maximum | 10.7% | 23.7% |
| Range | 9.4% | 22.8% |
| Mean | 6.8% | 7.2% |
| Median | 6.8% | 6.9% |
| Interquartile 25% (IQ1) | 6.3% | 5.8% |
| Interquartile 75% (IQ3) | 7.4% | 8.3% |
| Interquartile Range (IQR) | 1.1% | 2.5% |
| Standard Deviation (Sample) | 1.3% | 3.3% |
| Standard Deviation (Population) | 1.3% | 3.3% |
Demographics Similar to Immigrants and Chickasaw by Single Mother Households
In terms of single mother households, the demographic groups most similar to Immigrants are Immigrants from Eastern Africa (6.8%, a difference of 0.090%), Immigrants from Thailand (6.9%, a difference of 0.18%), Aleut (6.8%, a difference of 0.30%), French American Indian (6.9%, a difference of 0.38%), and Immigrants from Bangladesh (6.9%, a difference of 0.40%). Similarly, the demographic groups most similar to Chickasaw are Choctaw (7.0%, a difference of 0.020%), Immigrants from Burma/Myanmar (7.0%, a difference of 0.070%), Comanche (7.0%, a difference of 0.19%), Spanish American (7.0%, a difference of 0.25%), and Creek (7.0%, a difference of 0.27%).
| Demographics | Rating | Rank | Single Mother Households |
| Cherokee | 5.1 /100 | #216 | Tragic 6.8% |
| Aleuts | 4.8 /100 | #217 | Tragic 6.8% |
| Immigrants | Eastern Africa | 4.4 /100 | #218 | Tragic 6.8% |
| Immigrants | Immigrants | 4.3 /100 | #219 | Tragic 6.8% |
| Immigrants | Thailand | 4.0 /100 | #220 | Tragic 6.9% |
| French American Indians | 3.7 /100 | #221 | Tragic 6.9% |
| Immigrants | Bangladesh | 3.7 /100 | #222 | Tragic 6.9% |
| Immigrants | Micronesia | 3.6 /100 | #223 | Tragic 6.9% |
| Immigrants | Sudan | 3.5 /100 | #224 | Tragic 6.9% |
| Sudanese | 3.1 /100 | #225 | Tragic 6.9% |
| Paiute | 2.4 /100 | #226 | Tragic 7.0% |
| Kenyans | 2.3 /100 | #227 | Tragic 7.0% |
| Iroquois | 2.2 /100 | #228 | Tragic 7.0% |
| Immigrants | Kenya | 2.1 /100 | #229 | Tragic 7.0% |
| Creek | 1.6 /100 | #230 | Tragic 7.0% |
| Spanish Americans | 1.6 /100 | #231 | Tragic 7.0% |
| Comanche | 1.5 /100 | #232 | Tragic 7.0% |
| Choctaw | 1.4 /100 | #233 | Tragic 7.0% |
| Chickasaw | 1.4 /100 | #234 | Tragic 7.0% |
| Immigrants | Burma/Myanmar | 1.4 /100 | #235 | Tragic 7.0% |
| Ute | 1.0 /100 | #236 | Tragic 7.1% |