Hmong vs Hungarian Single Mother Households
COMPARE
Hmong
Hungarian
Single Mother Households
Single Mother Households Comparison
Hmong
Hungarians
6.4%
SINGLE MOTHER HOUSEHOLDS
39.8/ 100
METRIC RATING
179th/ 347
METRIC RANK
5.7%
SINGLE MOTHER HOUSEHOLDS
97.6/ 100
METRIC RATING
85th/ 347
METRIC RANK
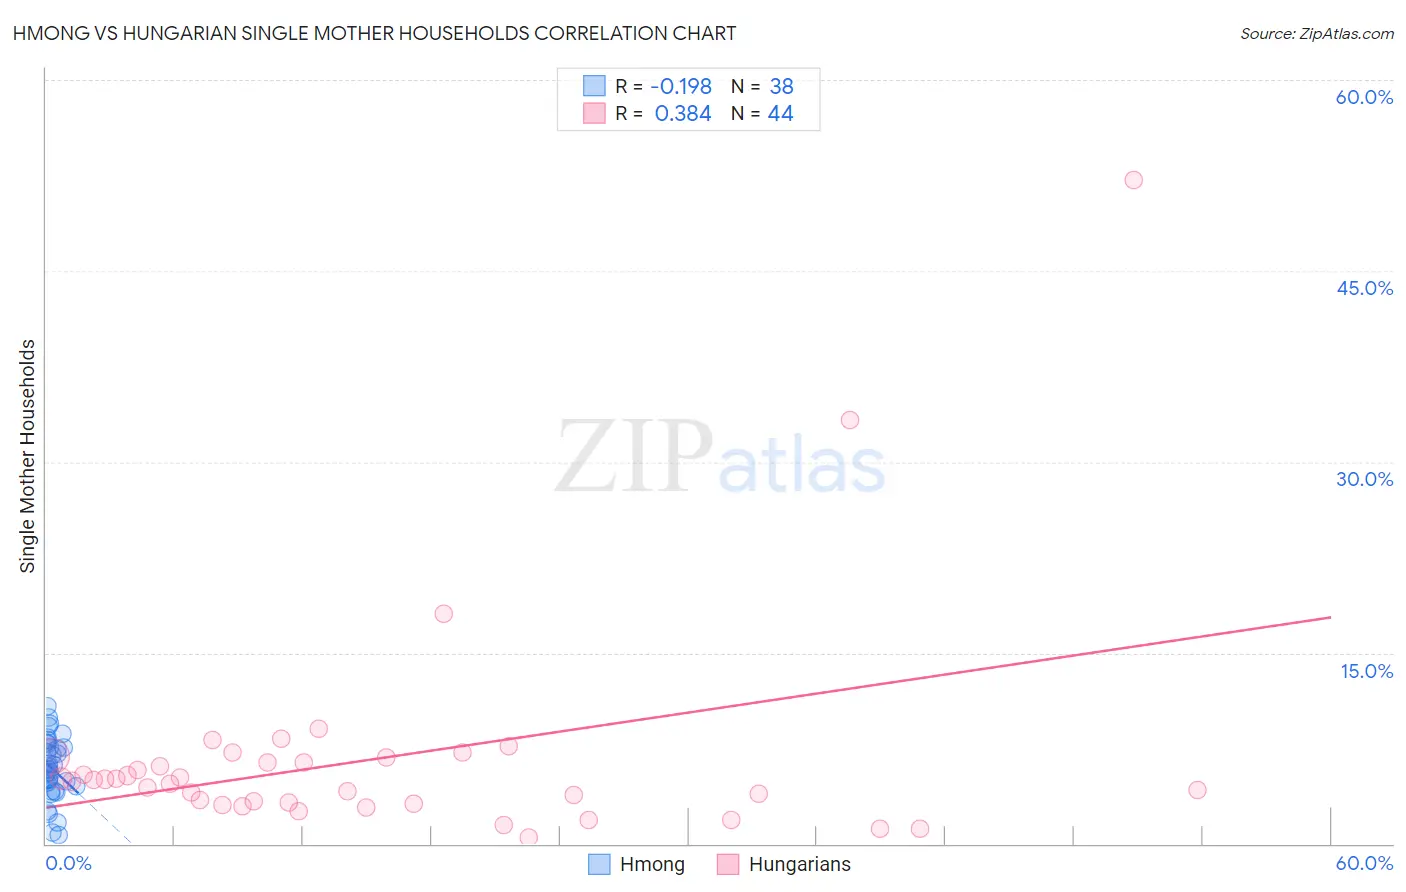
Hmong vs Hungarian Single Mother Households Correlation Chart
The statistical analysis conducted on geographies consisting of 24,669,739 people shows a poor negative correlation between the proportion of Hmong and percentage of single mother households in the United States with a correlation coefficient (R) of -0.198 and weighted average of 6.4%. Similarly, the statistical analysis conducted on geographies consisting of 483,597,168 people shows a mild positive correlation between the proportion of Hungarians and percentage of single mother households in the United States with a correlation coefficient (R) of 0.384 and weighted average of 5.7%, a difference of 12.5%.
Single Mother Households Correlation Summary
| Measurement | Hmong | Hungarian |
| Minimum | 0.72% | 0.48% |
| Maximum | 10.8% | 52.2% |
| Range | 10.1% | 51.7% |
| Mean | 5.9% | 6.6% |
| Median | 5.8% | 4.9% |
| Interquartile 25% (IQ1) | 4.5% | 3.2% |
| Interquartile 75% (IQ3) | 7.6% | 6.6% |
| Interquartile Range (IQR) | 3.1% | 3.4% |
| Standard Deviation (Sample) | 2.4% | 8.7% |
| Standard Deviation (Population) | 2.4% | 8.6% |
Similar Demographics by Single Mother Households
Demographics Similar to Hmong by Single Mother Households
In terms of single mother households, the demographic groups most similar to Hmong are Portuguese (6.4%, a difference of 0.020%), Osage (6.4%, a difference of 0.36%), Immigrants from Nepal (6.4%, a difference of 0.43%), Immigrants from Bosnia and Herzegovina (6.3%, a difference of 0.51%), and Marshallese (6.3%, a difference of 0.67%).
| Demographics | Rating | Rank | Single Mother Households |
| Immigrants | South Eastern Asia | 52.2 /100 | #172 | Average 6.3% |
| Immigrants | Vietnam | 51.5 /100 | #173 | Average 6.3% |
| Immigrants | Morocco | 50.0 /100 | #174 | Average 6.3% |
| Marshallese | 45.8 /100 | #175 | Average 6.3% |
| Immigrants | Bosnia and Herzegovina | 44.3 /100 | #176 | Average 6.3% |
| Osage | 43.0 /100 | #177 | Average 6.4% |
| Portuguese | 40.0 /100 | #178 | Fair 6.4% |
| Hmong | 39.8 /100 | #179 | Fair 6.4% |
| Immigrants | Nepal | 36.1 /100 | #180 | Fair 6.4% |
| Spanish | 33.4 /100 | #181 | Fair 6.4% |
| South American Indians | 33.4 /100 | #182 | Fair 6.4% |
| Spaniards | 27.8 /100 | #183 | Fair 6.5% |
| Ethiopians | 26.0 /100 | #184 | Fair 6.5% |
| Ugandans | 25.6 /100 | #185 | Fair 6.5% |
| Costa Ricans | 24.8 /100 | #186 | Fair 6.5% |
Demographics Similar to Hungarians by Single Mother Households
In terms of single mother households, the demographic groups most similar to Hungarians are Finnish (5.7%, a difference of 0.030%), Immigrants from Turkey (5.7%, a difference of 0.11%), Carpatho Rusyn (5.7%, a difference of 0.15%), Israeli (5.7%, a difference of 0.18%), and Immigrants from Hungary (5.7%, a difference of 0.23%).
| Demographics | Rating | Rank | Single Mother Households |
| Swiss | 98.1 /100 | #78 | Exceptional 5.6% |
| Immigrants | Sri Lanka | 98.0 /100 | #79 | Exceptional 5.6% |
| Czechs | 97.9 /100 | #80 | Exceptional 5.6% |
| Immigrants | Moldova | 97.9 /100 | #81 | Exceptional 5.6% |
| Immigrants | Malaysia | 97.8 /100 | #82 | Exceptional 5.7% |
| Immigrants | Hungary | 97.8 /100 | #83 | Exceptional 5.7% |
| Carpatho Rusyns | 97.7 /100 | #84 | Exceptional 5.7% |
| Hungarians | 97.6 /100 | #85 | Exceptional 5.7% |
| Finns | 97.6 /100 | #86 | Exceptional 5.7% |
| Immigrants | Turkey | 97.5 /100 | #87 | Exceptional 5.7% |
| Israelis | 97.4 /100 | #88 | Exceptional 5.7% |
| Ukrainians | 97.2 /100 | #89 | Exceptional 5.7% |
| Immigrants | Indonesia | 97.2 /100 | #90 | Exceptional 5.7% |
| Europeans | 97.0 /100 | #91 | Exceptional 5.7% |
| Immigrants | Western Asia | 96.7 /100 | #92 | Exceptional 5.7% |