Hmong vs Tsimshian Single Mother Households
COMPARE
Hmong
Tsimshian
Single Mother Households
Single Mother Households Comparison
Hmong
Tsimshian
6.4%
SINGLE MOTHER HOUSEHOLDS
39.8/ 100
METRIC RATING
179th/ 347
METRIC RANK
6.0%
SINGLE MOTHER HOUSEHOLDS
85.2/ 100
METRIC RATING
141st/ 347
METRIC RANK
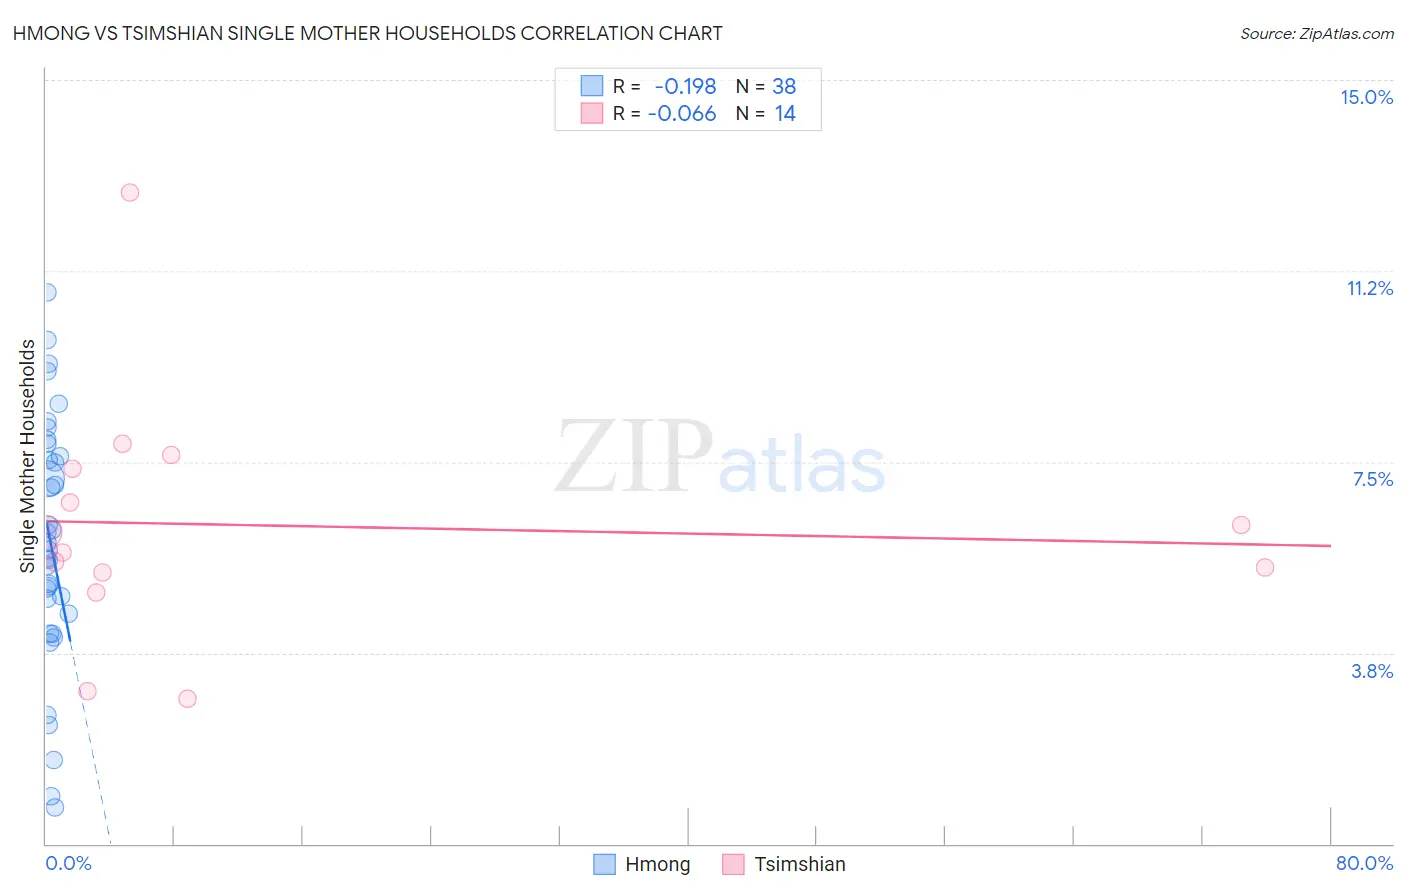
Hmong vs Tsimshian Single Mother Households Correlation Chart
The statistical analysis conducted on geographies consisting of 24,669,739 people shows a poor negative correlation between the proportion of Hmong and percentage of single mother households in the United States with a correlation coefficient (R) of -0.198 and weighted average of 6.4%. Similarly, the statistical analysis conducted on geographies consisting of 15,617,285 people shows a slight negative correlation between the proportion of Tsimshian and percentage of single mother households in the United States with a correlation coefficient (R) of -0.066 and weighted average of 6.0%, a difference of 6.2%.
Single Mother Households Correlation Summary
| Measurement | Hmong | Tsimshian |
| Minimum | 0.72% | 2.8% |
| Maximum | 10.8% | 12.8% |
| Range | 10.1% | 10.0% |
| Mean | 5.9% | 6.3% |
| Median | 5.8% | 5.9% |
| Interquartile 25% (IQ1) | 4.5% | 5.3% |
| Interquartile 75% (IQ3) | 7.6% | 7.4% |
| Interquartile Range (IQR) | 3.1% | 2.1% |
| Standard Deviation (Sample) | 2.4% | 2.4% |
| Standard Deviation (Population) | 2.4% | 2.3% |
Similar Demographics by Single Mother Households
Demographics Similar to Hmong by Single Mother Households
In terms of single mother households, the demographic groups most similar to Hmong are Portuguese (6.4%, a difference of 0.020%), Osage (6.4%, a difference of 0.36%), Immigrants from Nepal (6.4%, a difference of 0.43%), Immigrants from Bosnia and Herzegovina (6.3%, a difference of 0.51%), and Marshallese (6.3%, a difference of 0.67%).
| Demographics | Rating | Rank | Single Mother Households |
| Immigrants | South Eastern Asia | 52.2 /100 | #172 | Average 6.3% |
| Immigrants | Vietnam | 51.5 /100 | #173 | Average 6.3% |
| Immigrants | Morocco | 50.0 /100 | #174 | Average 6.3% |
| Marshallese | 45.8 /100 | #175 | Average 6.3% |
| Immigrants | Bosnia and Herzegovina | 44.3 /100 | #176 | Average 6.3% |
| Osage | 43.0 /100 | #177 | Average 6.4% |
| Portuguese | 40.0 /100 | #178 | Fair 6.4% |
| Hmong | 39.8 /100 | #179 | Fair 6.4% |
| Immigrants | Nepal | 36.1 /100 | #180 | Fair 6.4% |
| Spanish | 33.4 /100 | #181 | Fair 6.4% |
| South American Indians | 33.4 /100 | #182 | Fair 6.4% |
| Spaniards | 27.8 /100 | #183 | Fair 6.5% |
| Ethiopians | 26.0 /100 | #184 | Fair 6.5% |
| Ugandans | 25.6 /100 | #185 | Fair 6.5% |
| Costa Ricans | 24.8 /100 | #186 | Fair 6.5% |
Demographics Similar to Tsimshian by Single Mother Households
In terms of single mother households, the demographic groups most similar to Tsimshian are Immigrants from Egypt (6.0%, a difference of 0.050%), Immigrants from Iraq (6.0%, a difference of 0.090%), French (6.0%, a difference of 0.10%), Syrian (6.0%, a difference of 0.17%), and Korean (6.0%, a difference of 0.19%).
| Demographics | Rating | Rank | Single Mother Households |
| Canadians | 90.5 /100 | #134 | Exceptional 5.9% |
| Immigrants | Saudi Arabia | 90.2 /100 | #135 | Exceptional 5.9% |
| Jordanians | 88.9 /100 | #136 | Excellent 6.0% |
| Immigrants | Pakistan | 88.4 /100 | #137 | Excellent 6.0% |
| Icelanders | 86.9 /100 | #138 | Excellent 6.0% |
| Syrians | 86.0 /100 | #139 | Excellent 6.0% |
| French | 85.7 /100 | #140 | Excellent 6.0% |
| Tsimshian | 85.2 /100 | #141 | Excellent 6.0% |
| Immigrants | Egypt | 85.0 /100 | #142 | Excellent 6.0% |
| Immigrants | Iraq | 84.8 /100 | #143 | Excellent 6.0% |
| Koreans | 84.4 /100 | #144 | Excellent 6.0% |
| Arabs | 84.0 /100 | #145 | Excellent 6.0% |
| French Canadians | 82.6 /100 | #146 | Excellent 6.0% |
| Immigrants | Jordan | 82.3 /100 | #147 | Excellent 6.0% |
| Scotch-Irish | 82.0 /100 | #148 | Excellent 6.0% |