Yugoslavian vs Danish Married-couple Households
COMPARE
Yugoslavian
Danish
Married-couple Households
Married-couple Households Comparison
Yugoslavians
Danes
46.2%
MARRIED-COUPLE HOUSEHOLDS
38.9/ 100
METRIC RATING
182nd/ 347
METRIC RANK
51.1%
MARRIED-COUPLE HOUSEHOLDS
100.0/ 100
METRIC RATING
6th/ 347
METRIC RANK
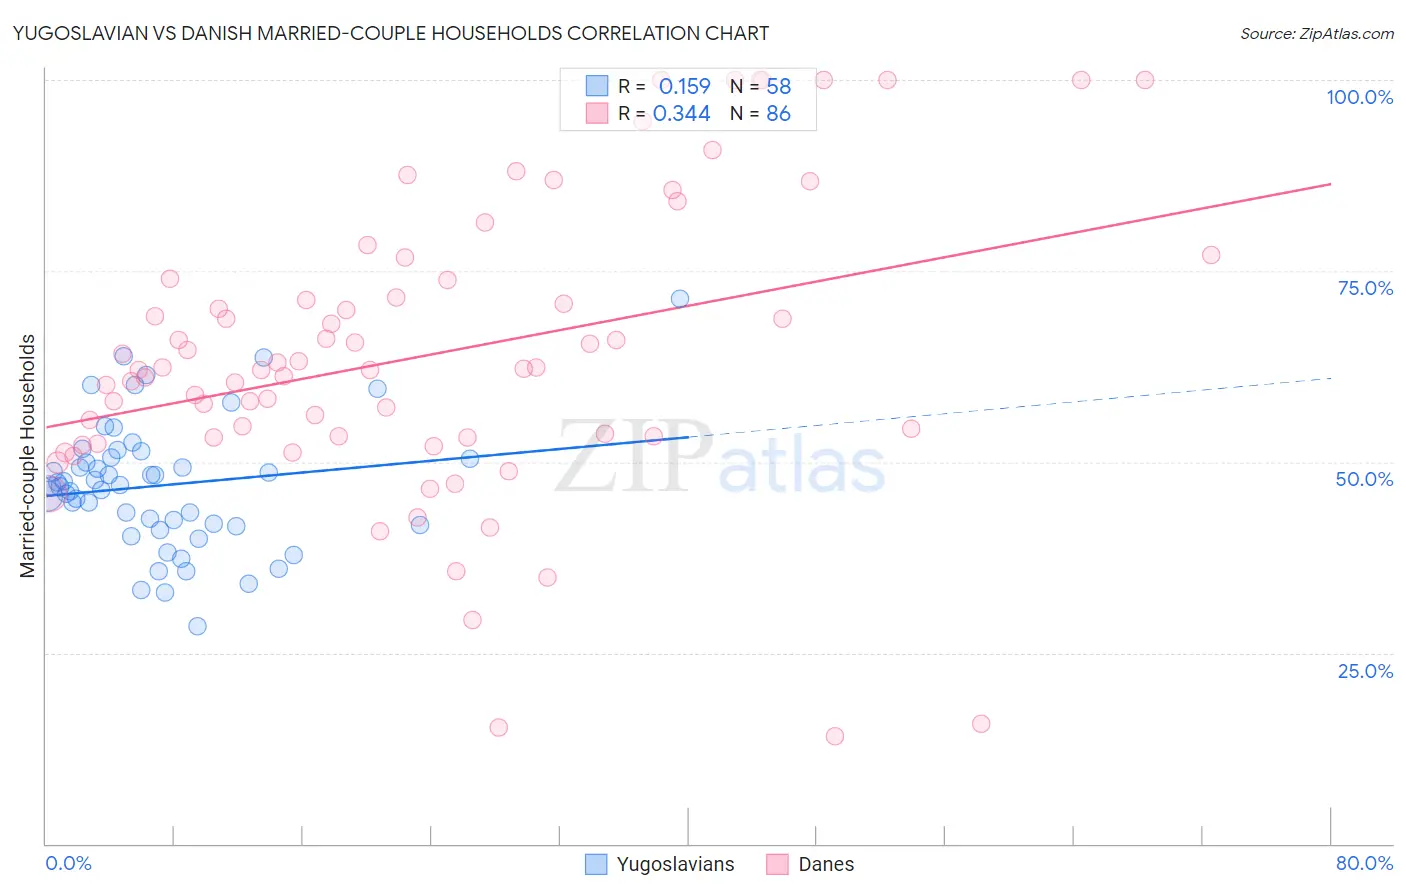
Yugoslavian vs Danish Married-couple Households Correlation Chart
The statistical analysis conducted on geographies consisting of 285,634,197 people shows a poor positive correlation between the proportion of Yugoslavians and percentage of married-couple family households in the United States with a correlation coefficient (R) of 0.159 and weighted average of 46.2%. Similarly, the statistical analysis conducted on geographies consisting of 473,893,305 people shows a mild positive correlation between the proportion of Danes and percentage of married-couple family households in the United States with a correlation coefficient (R) of 0.344 and weighted average of 51.1%, a difference of 10.4%.
Married-couple Households Correlation Summary
| Measurement | Yugoslavian | Danish |
| Minimum | 28.5% | 14.0% |
| Maximum | 71.4% | 100.0% |
| Range | 42.9% | 86.0% |
| Mean | 47.0% | 64.0% |
| Median | 46.8% | 62.1% |
| Interquartile 25% (IQ1) | 41.7% | 53.2% |
| Interquartile 75% (IQ3) | 50.6% | 73.9% |
| Interquartile Range (IQR) | 9.0% | 20.6% |
| Standard Deviation (Sample) | 8.5% | 19.2% |
| Standard Deviation (Population) | 8.4% | 19.1% |
Similar Demographics by Married-couple Households
Demographics Similar to Yugoslavians by Married-couple Households
In terms of married-couple households, the demographic groups most similar to Yugoslavians are Immigrants from Brazil (46.2%, a difference of 0.020%), Immigrants from Switzerland (46.2%, a difference of 0.080%), Mongolian (46.3%, a difference of 0.12%), Malaysian (46.3%, a difference of 0.12%), and Brazilian (46.2%, a difference of 0.12%).
| Demographics | Rating | Rank | Married-couple Households |
| Immigrants | Colombia | 46.1 /100 | #175 | Average 46.4% |
| Cajuns | 45.2 /100 | #176 | Average 46.4% |
| Immigrants | Immigrants | 43.8 /100 | #177 | Average 46.3% |
| Immigrants | Costa Rica | 43.4 /100 | #178 | Average 46.3% |
| Immigrants | Zimbabwe | 43.0 /100 | #179 | Average 46.3% |
| Mongolians | 42.0 /100 | #180 | Average 46.3% |
| Malaysians | 41.8 /100 | #181 | Average 46.3% |
| Yugoslavians | 38.9 /100 | #182 | Fair 46.2% |
| Immigrants | Brazil | 38.3 /100 | #183 | Fair 46.2% |
| Immigrants | Switzerland | 36.9 /100 | #184 | Fair 46.2% |
| Brazilians | 35.9 /100 | #185 | Fair 46.2% |
| Albanians | 31.1 /100 | #186 | Fair 46.1% |
| Fijians | 29.2 /100 | #187 | Fair 46.1% |
| South American Indians | 28.4 /100 | #188 | Fair 46.0% |
| Immigrants | Latvia | 26.9 /100 | #189 | Fair 46.0% |
Demographics Similar to Danes by Married-couple Households
In terms of married-couple households, the demographic groups most similar to Danes are Filipino (51.0%, a difference of 0.22%), Immigrants from South Central Asia (50.6%, a difference of 0.86%), Tongan (51.6%, a difference of 0.98%), Pennsylvania German (50.4%, a difference of 1.4%), and Chinese (50.4%, a difference of 1.4%).
| Demographics | Rating | Rank | Married-couple Households |
| Immigrants | India | 100.0 /100 | #1 | Exceptional 52.7% |
| Immigrants | Taiwan | 100.0 /100 | #2 | Exceptional 52.4% |
| Thais | 100.0 /100 | #3 | Exceptional 51.9% |
| Assyrians/Chaldeans/Syriacs | 100.0 /100 | #4 | Exceptional 51.8% |
| Tongans | 100.0 /100 | #5 | Exceptional 51.6% |
| Danes | 100.0 /100 | #6 | Exceptional 51.1% |
| Filipinos | 100.0 /100 | #7 | Exceptional 51.0% |
| Immigrants | South Central Asia | 100.0 /100 | #8 | Exceptional 50.6% |
| Pennsylvania Germans | 100.0 /100 | #9 | Exceptional 50.4% |
| Chinese | 100.0 /100 | #10 | Exceptional 50.4% |
| Immigrants | Pakistan | 100.0 /100 | #11 | Exceptional 50.1% |
| Swiss | 100.0 /100 | #12 | Exceptional 49.9% |
| Immigrants | Korea | 100.0 /100 | #13 | Exceptional 49.9% |
| Burmese | 100.0 /100 | #14 | Exceptional 49.8% |
| Koreans | 99.9 /100 | #15 | Exceptional 49.7% |