Soviet Union vs Danish Married-couple Households
COMPARE
Soviet Union
Danish
Married-couple Households
Married-couple Households Comparison
Soviet Union
Danes
44.6%
MARRIED-COUPLE HOUSEHOLDS
1.6/ 100
METRIC RATING
230th/ 347
METRIC RANK
51.1%
MARRIED-COUPLE HOUSEHOLDS
100.0/ 100
METRIC RATING
6th/ 347
METRIC RANK
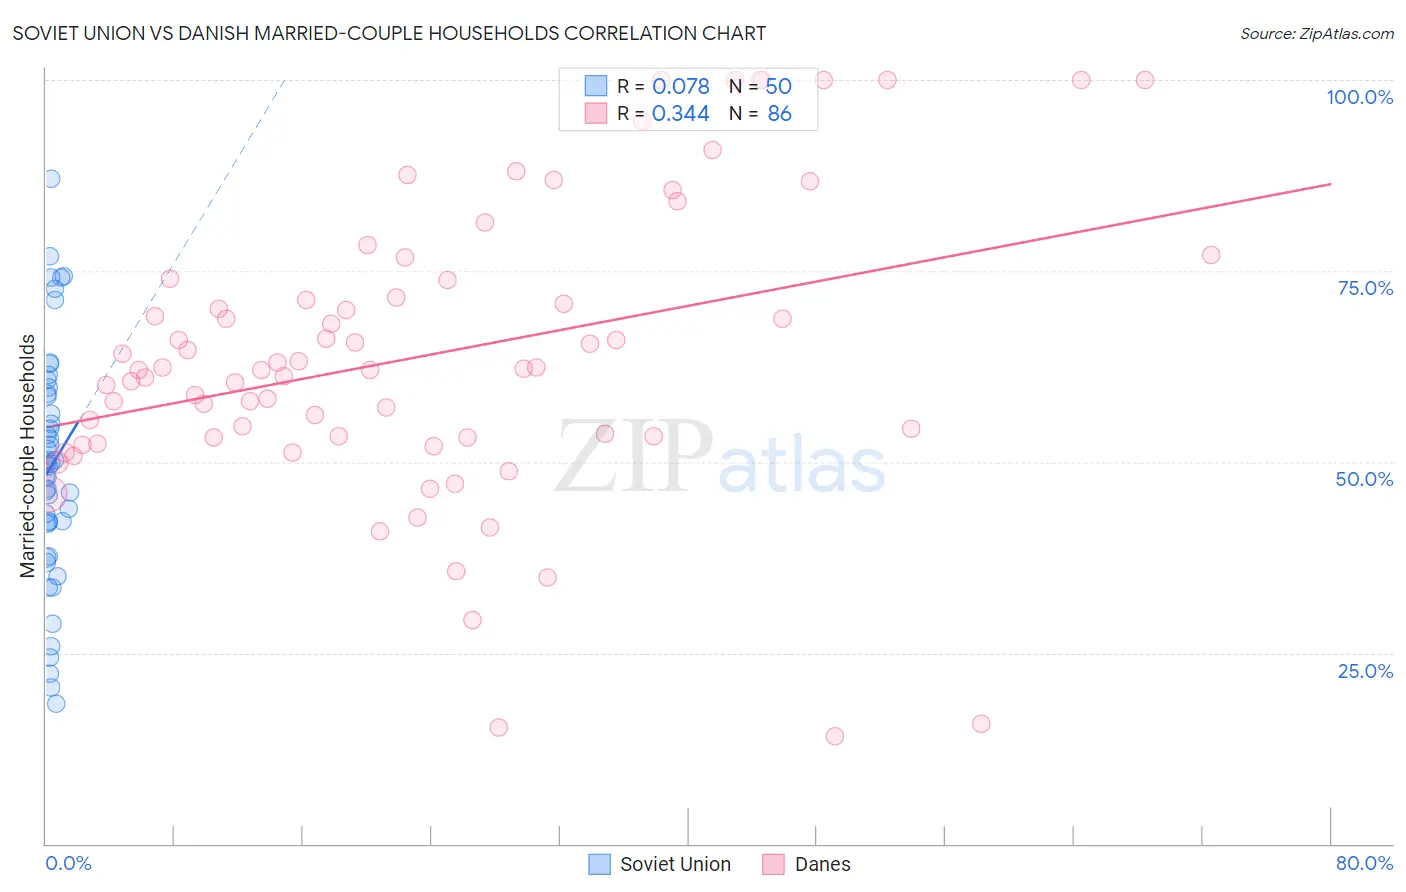
Soviet Union vs Danish Married-couple Households Correlation Chart
The statistical analysis conducted on geographies consisting of 43,509,630 people shows a slight positive correlation between the proportion of Soviet Union and percentage of married-couple family households in the United States with a correlation coefficient (R) of 0.078 and weighted average of 44.6%. Similarly, the statistical analysis conducted on geographies consisting of 473,893,305 people shows a mild positive correlation between the proportion of Danes and percentage of married-couple family households in the United States with a correlation coefficient (R) of 0.344 and weighted average of 51.1%, a difference of 14.4%.
Married-couple Households Correlation Summary
| Measurement | Soviet Union | Danish |
| Minimum | 18.4% | 14.0% |
| Maximum | 87.0% | 100.0% |
| Range | 68.6% | 86.0% |
| Mean | 49.4% | 64.0% |
| Median | 49.6% | 62.1% |
| Interquartile 25% (IQ1) | 41.9% | 53.2% |
| Interquartile 75% (IQ3) | 58.9% | 73.9% |
| Interquartile Range (IQR) | 17.0% | 20.6% |
| Standard Deviation (Sample) | 15.5% | 19.2% |
| Standard Deviation (Population) | 15.3% | 19.1% |
Similar Demographics by Married-couple Households
Demographics Similar to Soviet Union by Married-couple Households
In terms of married-couple households, the demographic groups most similar to Soviet Union are Houma (44.6%, a difference of 0.010%), Marshallese (44.6%, a difference of 0.010%), Immigrants from Latin America (44.7%, a difference of 0.040%), Immigrants from Uganda (44.6%, a difference of 0.050%), and Kenyan (44.7%, a difference of 0.090%).
| Demographics | Rating | Rank | Married-couple Households |
| Immigrants | Cambodia | 2.7 /100 | #223 | Tragic 44.9% |
| Immigrants | Micronesia | 2.6 /100 | #224 | Tragic 44.9% |
| Dutch West Indians | 2.6 /100 | #225 | Tragic 44.9% |
| Alsatians | 2.3 /100 | #226 | Tragic 44.8% |
| Salvadorans | 1.9 /100 | #227 | Tragic 44.7% |
| Kenyans | 1.7 /100 | #228 | Tragic 44.7% |
| Immigrants | Latin America | 1.6 /100 | #229 | Tragic 44.7% |
| Soviet Union | 1.6 /100 | #230 | Tragic 44.6% |
| Houma | 1.5 /100 | #231 | Tragic 44.6% |
| Marshallese | 1.5 /100 | #232 | Tragic 44.6% |
| Immigrants | Uganda | 1.5 /100 | #233 | Tragic 44.6% |
| Immigrants | Panama | 1.3 /100 | #234 | Tragic 44.6% |
| Immigrants | Nicaragua | 1.2 /100 | #235 | Tragic 44.5% |
| Yaqui | 1.2 /100 | #236 | Tragic 44.5% |
| Comanche | 1.2 /100 | #237 | Tragic 44.5% |
Demographics Similar to Danes by Married-couple Households
In terms of married-couple households, the demographic groups most similar to Danes are Filipino (51.0%, a difference of 0.22%), Immigrants from South Central Asia (50.6%, a difference of 0.86%), Tongan (51.6%, a difference of 0.98%), Pennsylvania German (50.4%, a difference of 1.4%), and Chinese (50.4%, a difference of 1.4%).
| Demographics | Rating | Rank | Married-couple Households |
| Immigrants | India | 100.0 /100 | #1 | Exceptional 52.7% |
| Immigrants | Taiwan | 100.0 /100 | #2 | Exceptional 52.4% |
| Thais | 100.0 /100 | #3 | Exceptional 51.9% |
| Assyrians/Chaldeans/Syriacs | 100.0 /100 | #4 | Exceptional 51.8% |
| Tongans | 100.0 /100 | #5 | Exceptional 51.6% |
| Danes | 100.0 /100 | #6 | Exceptional 51.1% |
| Filipinos | 100.0 /100 | #7 | Exceptional 51.0% |
| Immigrants | South Central Asia | 100.0 /100 | #8 | Exceptional 50.6% |
| Pennsylvania Germans | 100.0 /100 | #9 | Exceptional 50.4% |
| Chinese | 100.0 /100 | #10 | Exceptional 50.4% |
| Immigrants | Pakistan | 100.0 /100 | #11 | Exceptional 50.1% |
| Swiss | 100.0 /100 | #12 | Exceptional 49.9% |
| Immigrants | Korea | 100.0 /100 | #13 | Exceptional 49.9% |
| Burmese | 100.0 /100 | #14 | Exceptional 49.8% |
| Koreans | 99.9 /100 | #15 | Exceptional 49.7% |