Guamanian/Chamorro vs Yaqui Unemployment Among Ages 30 to 34 years
COMPARE
Guamanian/Chamorro
Yaqui
Unemployment Among Ages 30 to 34 years
Unemployment Among Ages 30 to 34 years Comparison
Guamanians/Chamorros
Yaqui
5.8%
UNEMPLOYMENT AMONG AGES 30 TO 34 YEARS
3.9/ 100
METRIC RATING
221st/ 347
METRIC RANK
5.9%
UNEMPLOYMENT AMONG AGES 30 TO 34 YEARS
0.7/ 100
METRIC RATING
235th/ 347
METRIC RANK
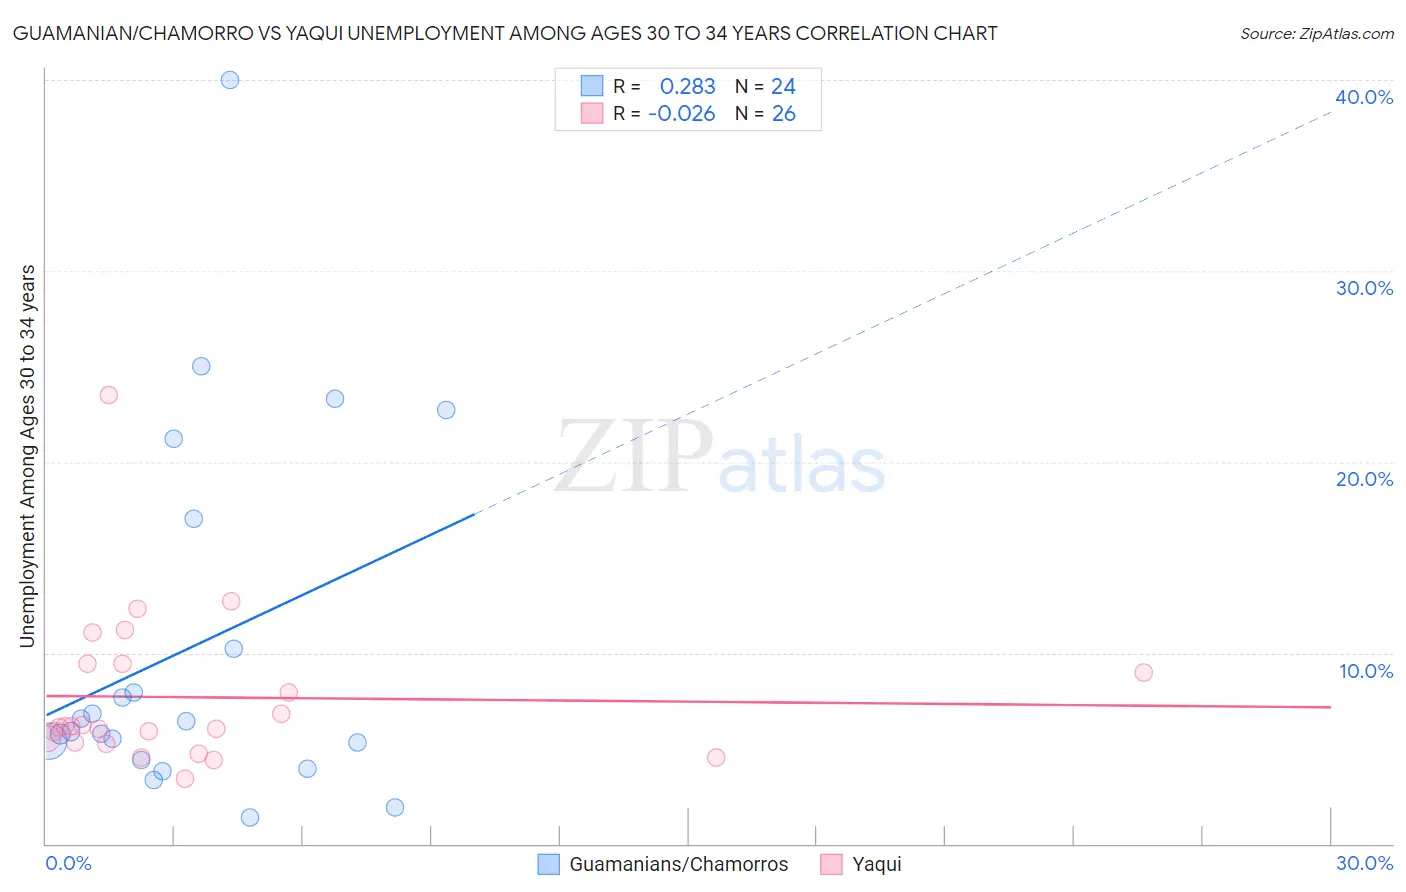
Guamanian/Chamorro vs Yaqui Unemployment Among Ages 30 to 34 years Correlation Chart
The statistical analysis conducted on geographies consisting of 215,599,306 people shows a weak positive correlation between the proportion of Guamanians/Chamorros and unemployment rate among population between the ages 30 and 34 in the United States with a correlation coefficient (R) of 0.283 and weighted average of 5.8%. Similarly, the statistical analysis conducted on geographies consisting of 106,044,835 people shows no correlation between the proportion of Yaqui and unemployment rate among population between the ages 30 and 34 in the United States with a correlation coefficient (R) of -0.026 and weighted average of 5.9%, a difference of 2.8%.
Unemployment Among Ages 30 to 34 years Correlation Summary
| Measurement | Guamanian/Chamorro | Yaqui |
| Minimum | 1.4% | 3.4% |
| Maximum | 40.0% | 23.5% |
| Range | 38.6% | 20.1% |
| Mean | 10.3% | 7.7% |
| Median | 6.2% | 6.1% |
| Interquartile 25% (IQ1) | 4.8% | 5.3% |
| Interquartile 75% (IQ3) | 13.6% | 9.4% |
| Interquartile Range (IQR) | 8.8% | 4.1% |
| Standard Deviation (Sample) | 9.5% | 4.1% |
| Standard Deviation (Population) | 9.3% | 4.0% |
Demographics Similar to Guamanians/Chamorros and Yaqui by Unemployment Among Ages 30 to 34 years
In terms of unemployment among ages 30 to 34 years, the demographic groups most similar to Guamanians/Chamorros are Sierra Leonean (5.8%, a difference of 0.020%), French Canadian (5.8%, a difference of 0.23%), Panamanian (5.8%, a difference of 0.26%), Spaniard (5.8%, a difference of 0.33%), and Bermudan (5.8%, a difference of 0.59%). Similarly, the demographic groups most similar to Yaqui are Portuguese (5.9%, a difference of 0.12%), Native Hawaiian (5.9%, a difference of 0.12%), Nepalese (5.9%, a difference of 0.15%), Central American (5.9%, a difference of 0.29%), and Mexican American Indian (5.9%, a difference of 0.38%).
| Demographics | Rating | Rank | Unemployment Among Ages 30 to 34 years |
| Panamanians | 4.5 /100 | #218 | Tragic 5.8% |
| French Canadians | 4.4 /100 | #219 | Tragic 5.8% |
| Sierra Leoneans | 3.9 /100 | #220 | Tragic 5.8% |
| Guamanians/Chamorros | 3.9 /100 | #221 | Tragic 5.8% |
| Spaniards | 3.2 /100 | #222 | Tragic 5.8% |
| Bermudans | 2.7 /100 | #223 | Tragic 5.8% |
| Slovaks | 2.5 /100 | #224 | Tragic 5.8% |
| Samoans | 2.5 /100 | #225 | Tragic 5.8% |
| Liberians | 2.3 /100 | #226 | Tragic 5.8% |
| Spanish | 1.8 /100 | #227 | Tragic 5.8% |
| Immigrants | Bahamas | 1.8 /100 | #228 | Tragic 5.8% |
| Immigrants | Uzbekistan | 1.5 /100 | #229 | Tragic 5.9% |
| Hawaiians | 1.2 /100 | #230 | Tragic 5.9% |
| Japanese | 1.1 /100 | #231 | Tragic 5.9% |
| Iroquois | 1.0 /100 | #232 | Tragic 5.9% |
| Nepalese | 0.8 /100 | #233 | Tragic 5.9% |
| Portuguese | 0.8 /100 | #234 | Tragic 5.9% |
| Yaqui | 0.7 /100 | #235 | Tragic 5.9% |
| Native Hawaiians | 0.7 /100 | #236 | Tragic 5.9% |
| Central Americans | 0.6 /100 | #237 | Tragic 5.9% |
| Mexican American Indians | 0.6 /100 | #238 | Tragic 5.9% |