Ghanaian vs Sioux Average Family Size
COMPARE
Ghanaian
Sioux
Average Family Size
Average Family Size Comparison
Ghanaians
Sioux
3.29
AVERAGE FAMILY SIZE
98.0/ 100
METRIC RATING
107th/ 347
METRIC RANK
3.52
AVERAGE FAMILY SIZE
100.0/ 100
METRIC RATING
13th/ 347
METRIC RANK
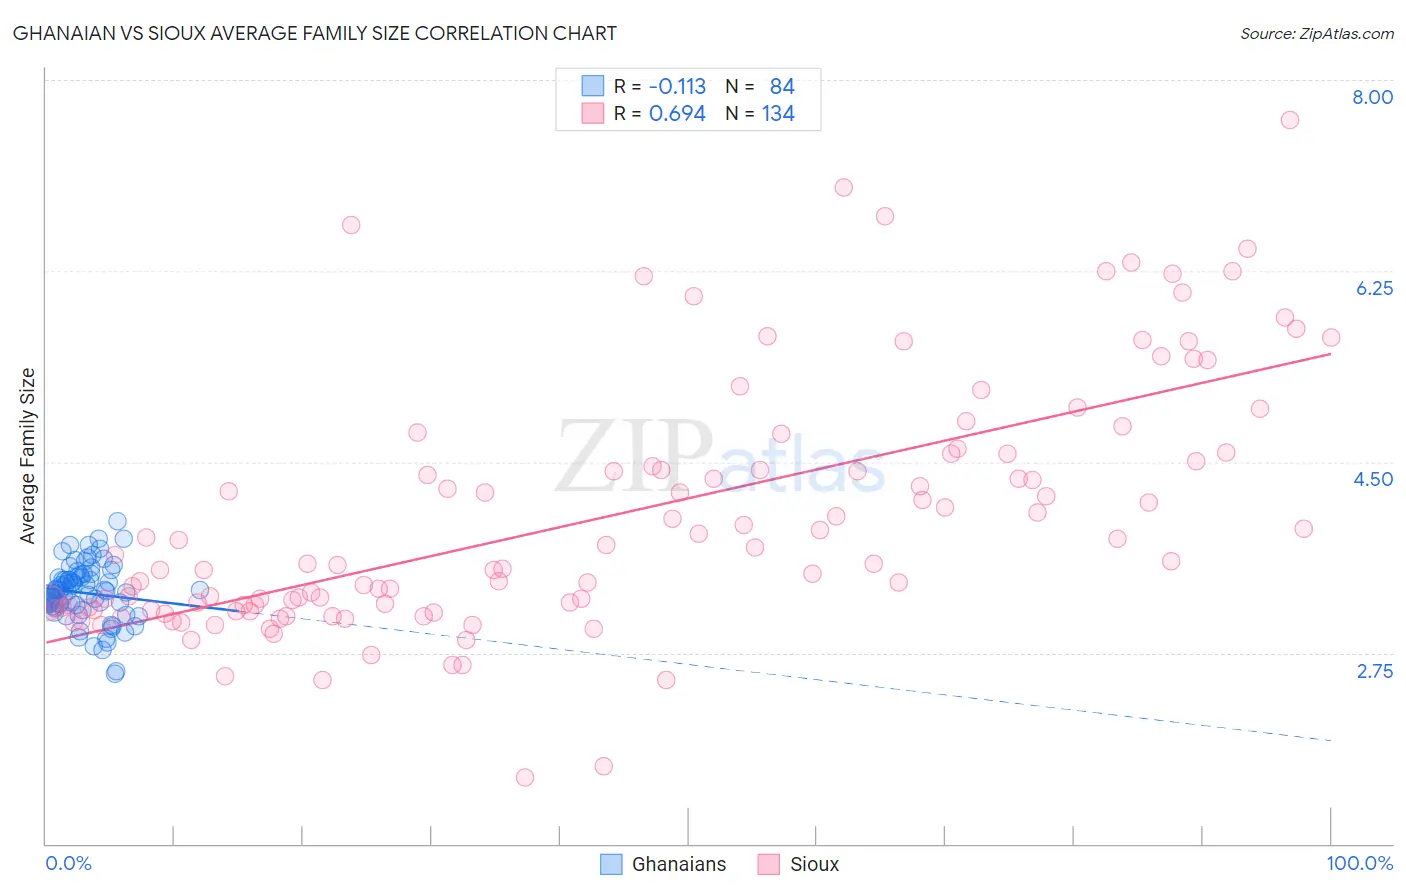
Ghanaian vs Sioux Average Family Size Correlation Chart
The statistical analysis conducted on geographies consisting of 190,523,422 people shows a poor negative correlation between the proportion of Ghanaians and average family size in the United States with a correlation coefficient (R) of -0.113 and weighted average of 3.29. Similarly, the statistical analysis conducted on geographies consisting of 234,114,463 people shows a significant positive correlation between the proportion of Sioux and average family size in the United States with a correlation coefficient (R) of 0.694 and weighted average of 3.52, a difference of 7.0%.
Average Family Size Correlation Summary
| Measurement | Ghanaian | Sioux |
| Minimum | 2.56 | 1.60 |
| Maximum | 3.96 | 7.63 |
| Range | 1.40 | 6.03 |
| Mean | 3.30 | 4.00 |
| Median | 3.32 | 3.58 |
| Interquartile 25% (IQ1) | 3.18 | 3.16 |
| Interquartile 75% (IQ3) | 3.44 | 4.58 |
| Interquartile Range (IQR) | 0.26 | 1.41 |
| Standard Deviation (Sample) | 0.26 | 1.15 |
| Standard Deviation (Population) | 0.26 | 1.14 |
Similar Demographics by Average Family Size
Demographics Similar to Ghanaians by Average Family Size
In terms of average family size, the demographic groups most similar to Ghanaians are Paiute (3.29, a difference of 0.020%), Immigrants from Ghana (3.29, a difference of 0.030%), Bolivian (3.29, a difference of 0.090%), Immigrants from Western Africa (3.29, a difference of 0.12%), and West Indian (3.29, a difference of 0.15%).
| Demographics | Rating | Rank | Average Family Size |
| Guamanians/Chamorros | 98.6 /100 | #100 | Exceptional 3.29 |
| Immigrants | Burma/Myanmar | 98.6 /100 | #101 | Exceptional 3.29 |
| West Indians | 98.5 /100 | #102 | Exceptional 3.29 |
| Immigrants | Western Africa | 98.4 /100 | #103 | Exceptional 3.29 |
| Bolivians | 98.3 /100 | #104 | Exceptional 3.29 |
| Immigrants | Ghana | 98.1 /100 | #105 | Exceptional 3.29 |
| Paiute | 98.0 /100 | #106 | Exceptional 3.29 |
| Ghanaians | 98.0 /100 | #107 | Exceptional 3.29 |
| Asians | 97.0 /100 | #108 | Exceptional 3.28 |
| Puerto Ricans | 96.7 /100 | #109 | Exceptional 3.28 |
| Bahamians | 96.6 /100 | #110 | Exceptional 3.28 |
| Indonesians | 96.2 /100 | #111 | Exceptional 3.28 |
| Blacks/African Americans | 95.7 /100 | #112 | Exceptional 3.27 |
| Immigrants | Panama | 95.6 /100 | #113 | Exceptional 3.27 |
| South Americans | 95.1 /100 | #114 | Exceptional 3.27 |
Demographics Similar to Sioux by Average Family Size
In terms of average family size, the demographic groups most similar to Sioux are Immigrants from Mexico (3.52, a difference of 0.080%), Tohono O'odham (3.53, a difference of 0.50%), Immigrants from Central America (3.49, a difference of 0.63%), Tongan (3.49, a difference of 0.68%), and Ute (3.49, a difference of 0.74%).
| Demographics | Rating | Rank | Average Family Size |
| Arapaho | 100.0 /100 | #6 | Exceptional 3.64 |
| Inupiat | 100.0 /100 | #7 | Exceptional 3.63 |
| Immigrants | Yemen | 100.0 /100 | #8 | Exceptional 3.60 |
| Hopi | 100.0 /100 | #9 | Exceptional 3.60 |
| Spanish American Indians | 100.0 /100 | #10 | Exceptional 3.58 |
| Tohono O'odham | 100.0 /100 | #11 | Exceptional 3.53 |
| Immigrants | Mexico | 100.0 /100 | #12 | Exceptional 3.52 |
| Sioux | 100.0 /100 | #13 | Exceptional 3.52 |
| Immigrants | Central America | 100.0 /100 | #14 | Exceptional 3.49 |
| Tongans | 100.0 /100 | #15 | Exceptional 3.49 |
| Ute | 100.0 /100 | #16 | Exceptional 3.49 |
| Immigrants | El Salvador | 100.0 /100 | #17 | Exceptional 3.49 |
| Salvadorans | 100.0 /100 | #18 | Exceptional 3.48 |
| Mexicans | 100.0 /100 | #19 | Exceptional 3.48 |
| Cheyenne | 100.0 /100 | #20 | Exceptional 3.47 |